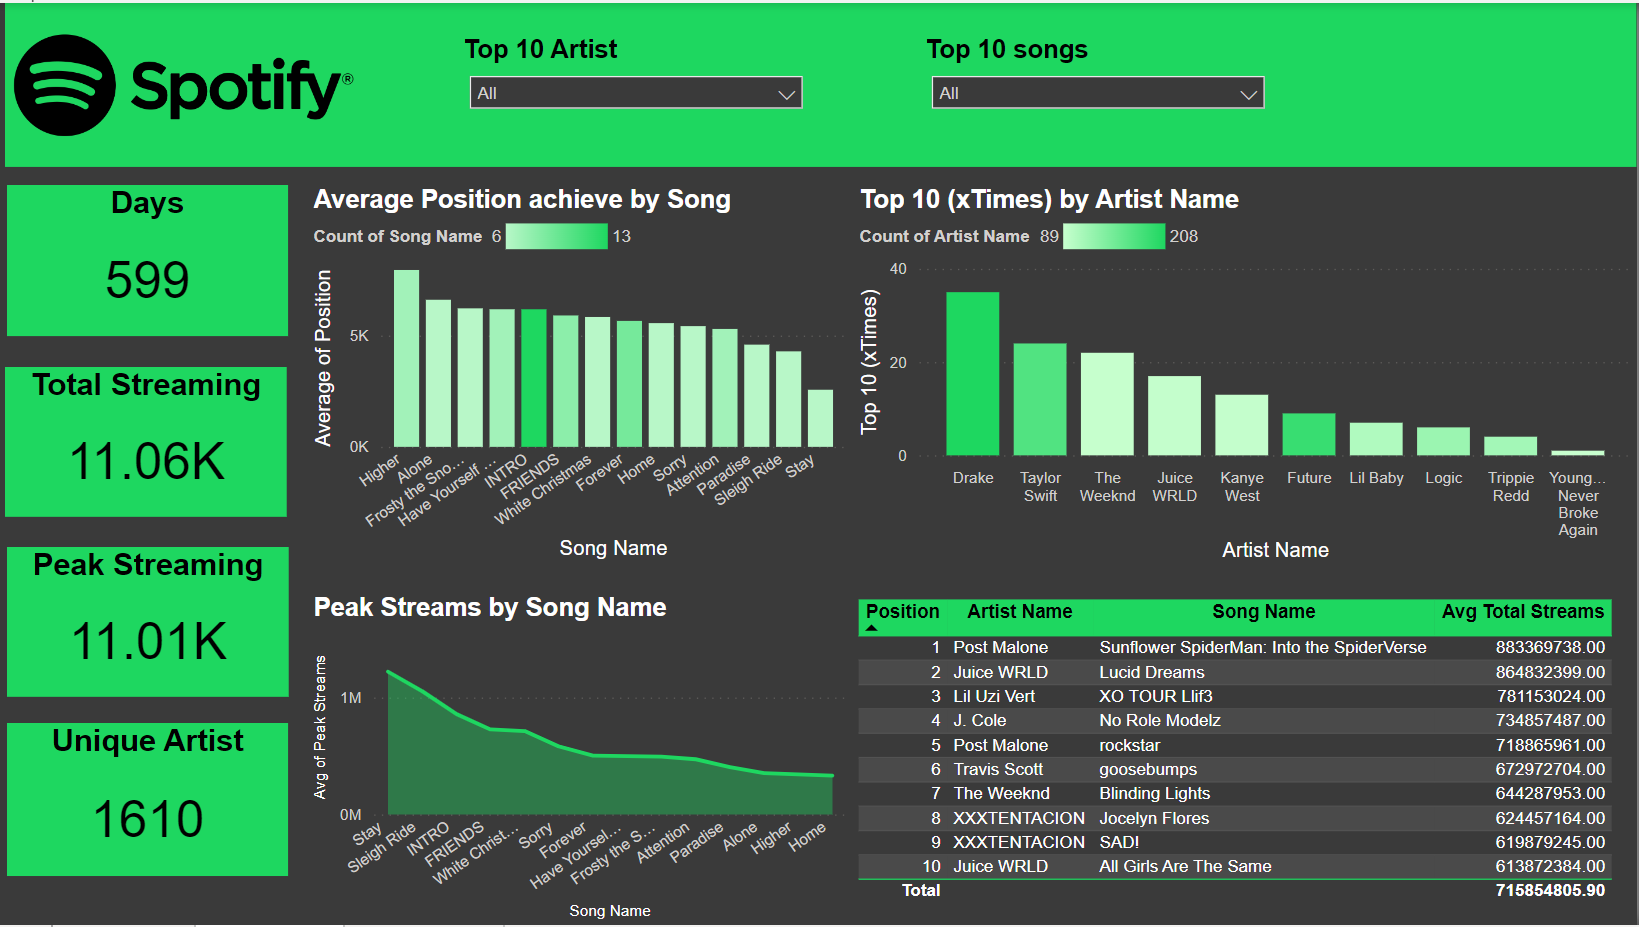
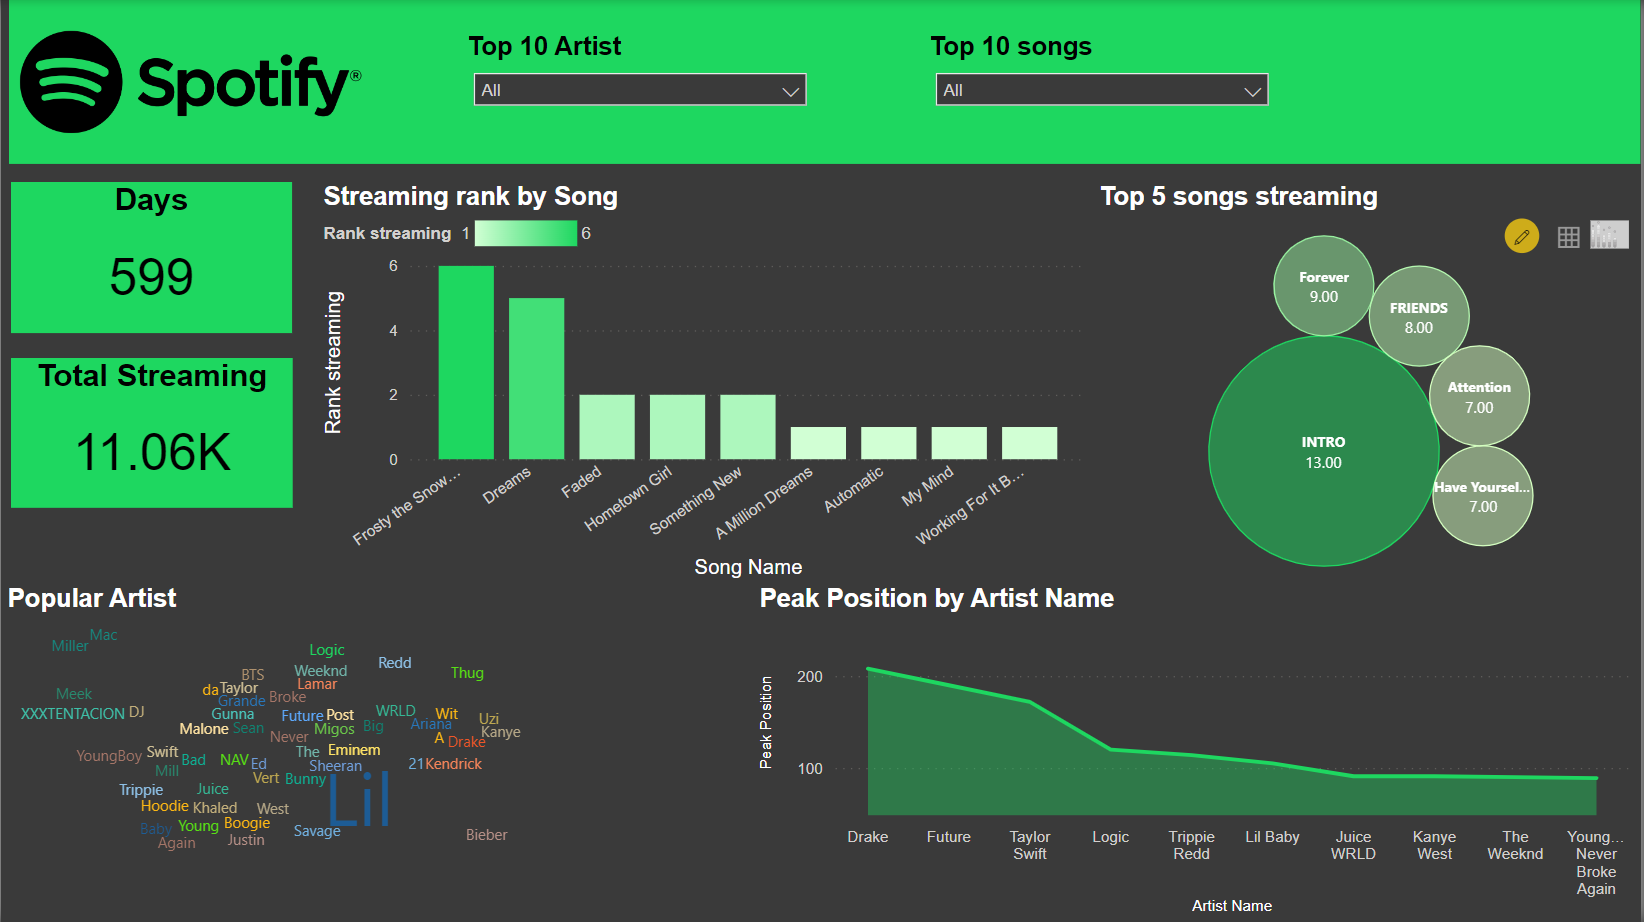
The Spotify Streaming Analytics Dashboard, built using Power BI, provides deep insights into top artists, popular songs, peak streaming hours, and overall listening trends. This interactive dashboard helps music industry professionals, marketers, and enthusiasts track real-time streaming activity, long-term trends, and emerging artists. By leveraging powerful visualizations and filters, users can explore the dynamics of Spotify's streaming data and make data-driven decisions regarding promotions, advertising, and audience engagement.
Spotify Streaming Insights Dashboard
Unlock Music Trends & Streaming Patterns with Interactive Insights
Category :
Entertainment
Powered by :
YBAISolution
Tool Used :
Power BI
Designer :
Bhrami Zadafiya
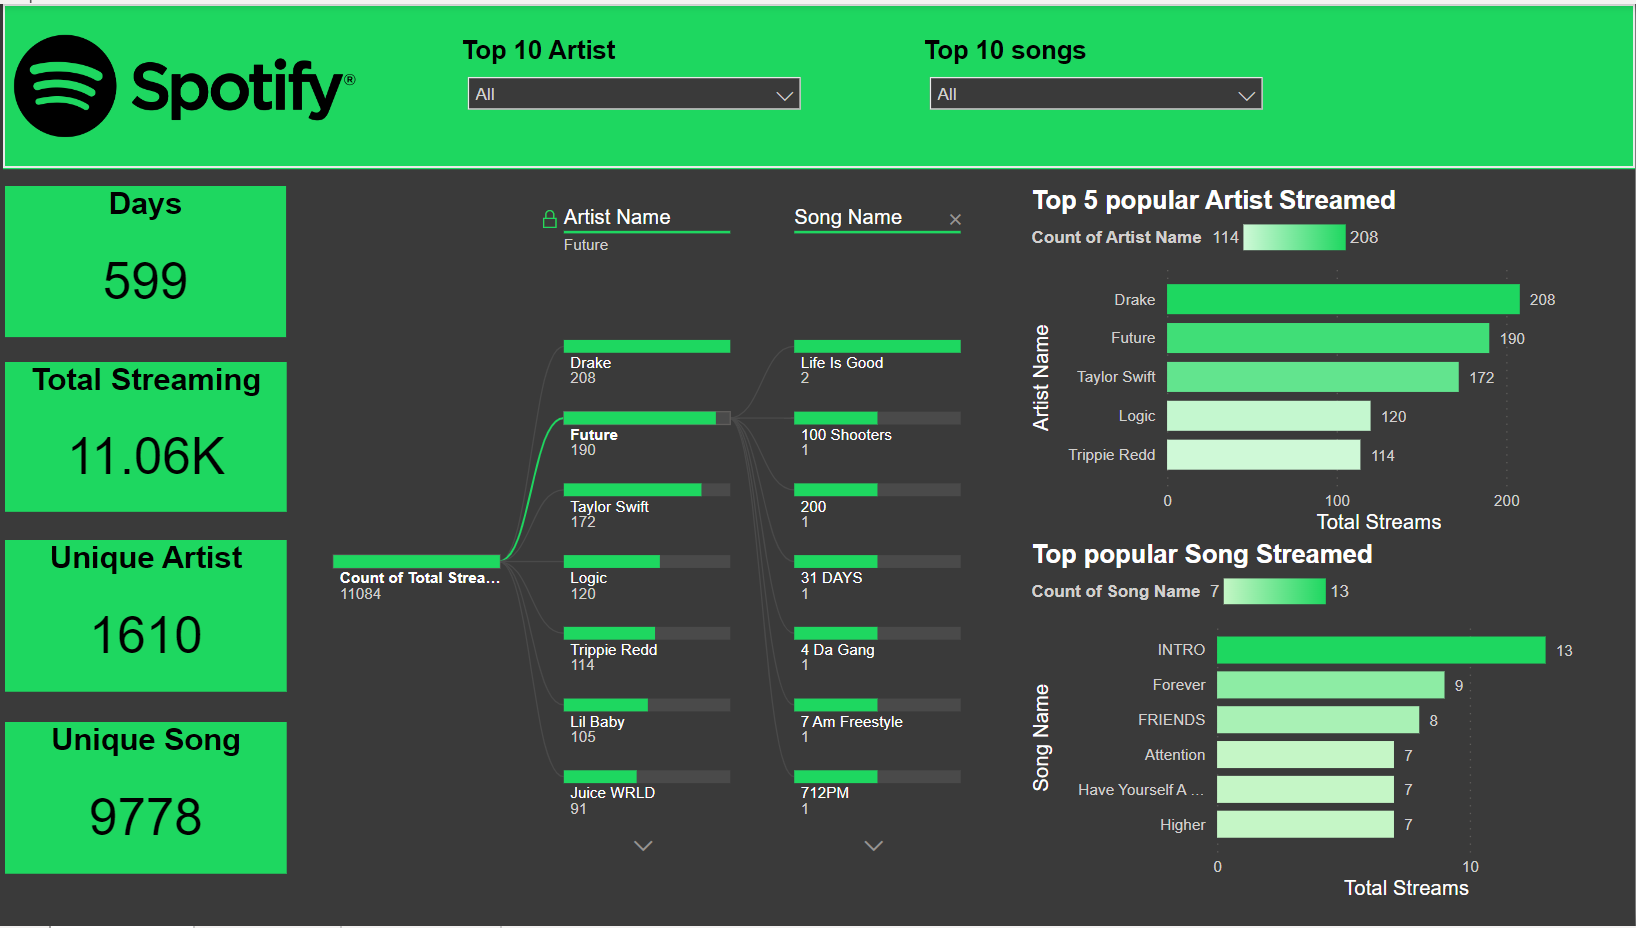
The Spotify Dashboard offers an intuitive interface designed to track and analyze Spotify’s most-streamed artists and songs, helping users understand audience behavior. It provides real-time insights into when listeners are most active, which artists are gaining traction, and how streaming patterns shift over time. With interactive filters and drill-through capabilities, users can explore streaming trends in detail, making it an essential tool for music labels, content creators, and marketers looking to optimize their strategies.
Additional Filters
The dashboard features interactive filters that allow users to customize their analysis based on different parameters:
🔹 Artist Filter: Focus on specific artists to track their performance
🔹 Song Filter: Analyze trends for individual tracks over time
🔹 Genre Filter: Compare streaming performance across different music genres
🔹 Date Filter: Select specific time periods to identify short-term and long-term trends
🔹 Peak Streaming Hour Filter: Examine the most active listening hours for targeted promotions
🔹 Region Filter: View streaming trends based on geographical location
Visualization Types:
- Card Visuals
- Drill-Through Capabilities
- Word cloud