Human resource management plays a vital role in any organization, ensuring efficient workforce management, retention strategies, and employee satisfaction. The HR Management Dashboard, built in Power BI, helps businesses analyze key employee metrics such as performance, salary distribution, retention trends, and reasons for attrition. With interactive visualizations and advanced filters, organizations can make data-driven decisions to optimize HR policies and improve workplace efficiency.
RecruitWise: Insightful Talent Matching Hub
Unlock Employee Insights for Smarter Workforce Decisions
Category :
Business Management
Powered by :
YbAISolution
Tool Used :
Power BI
Designer :
Bhrami Zadafiya
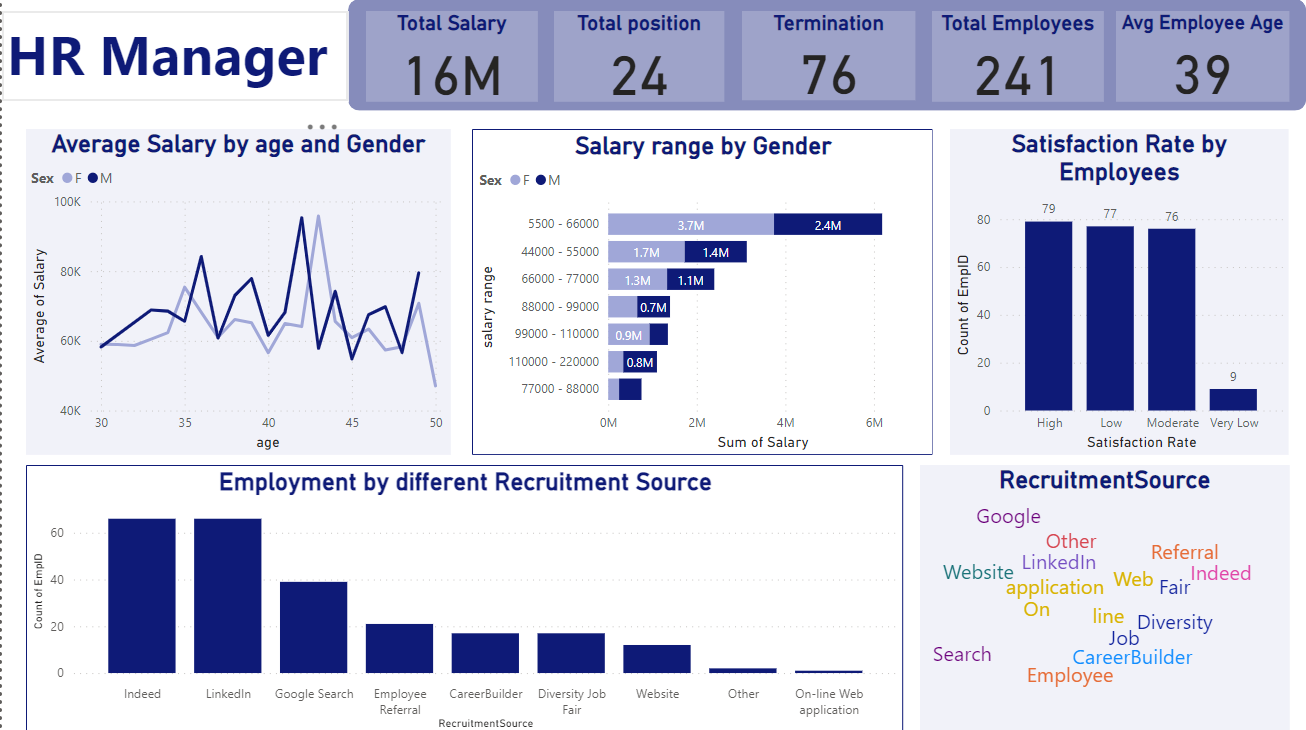
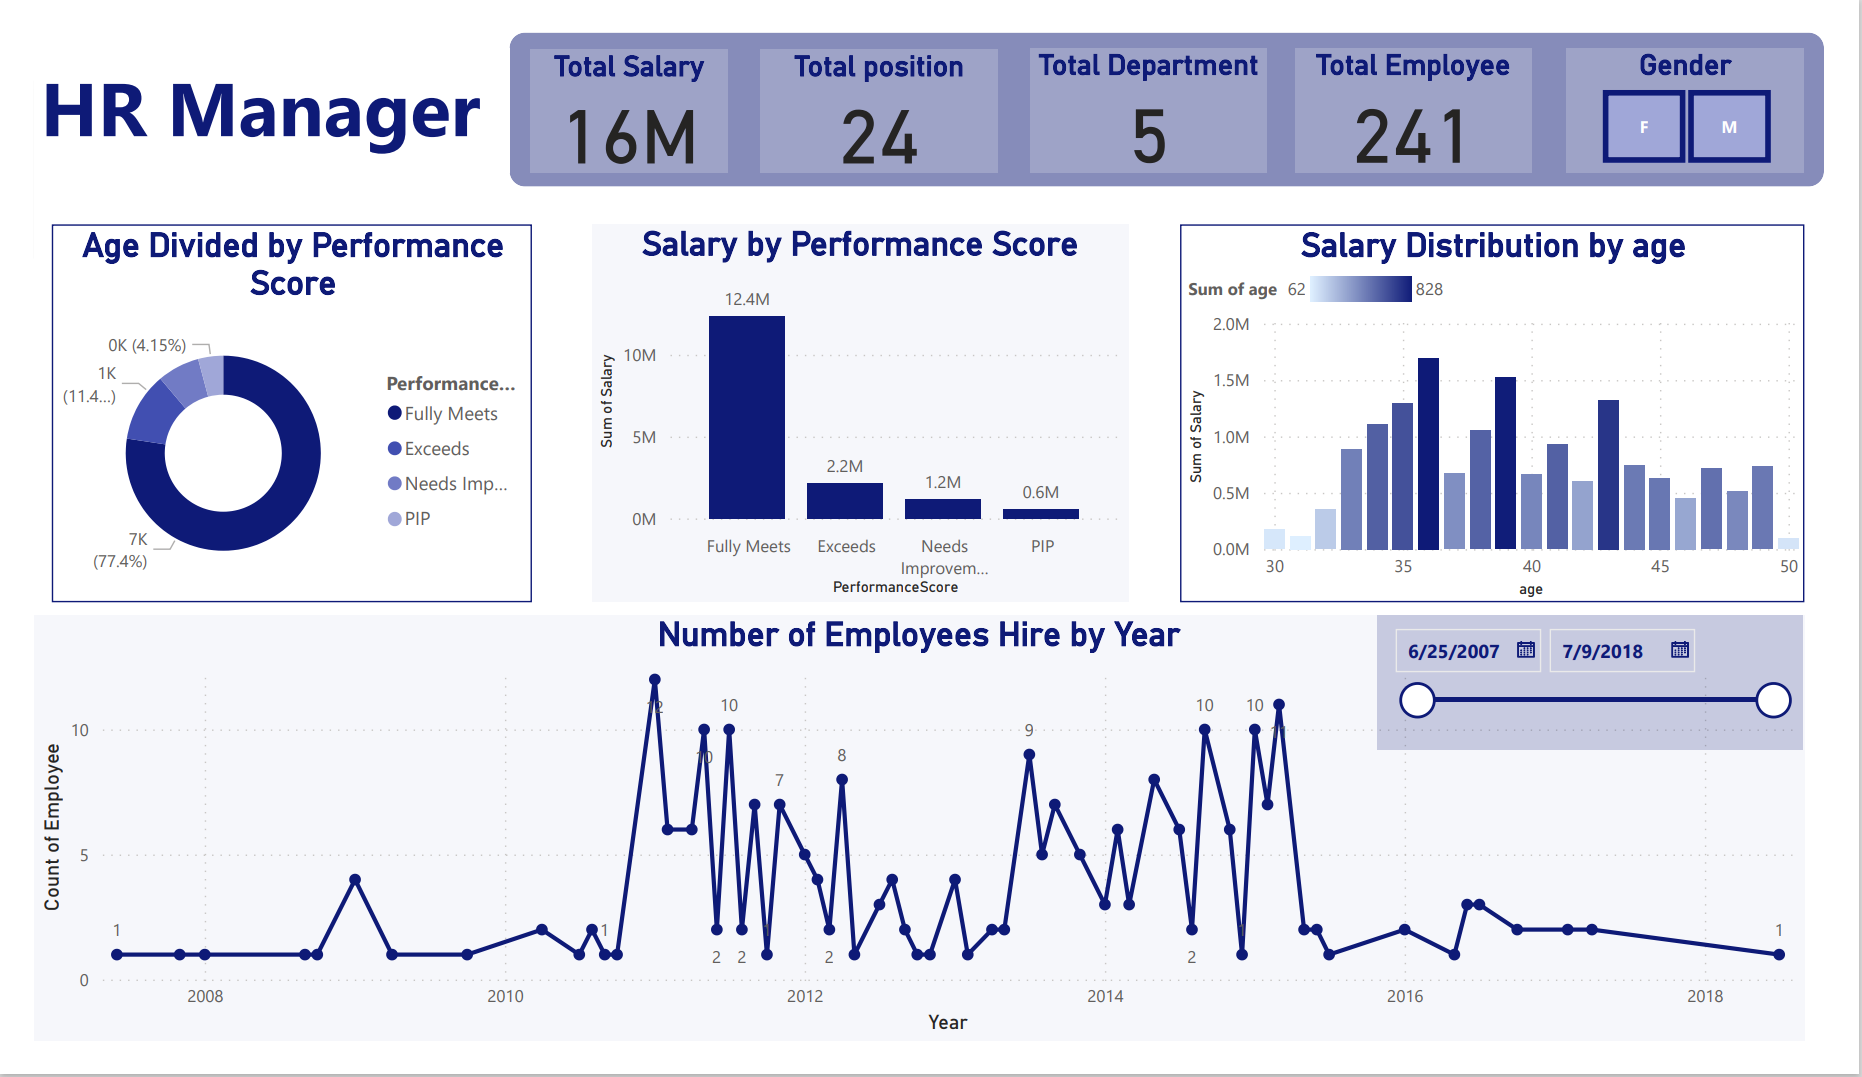
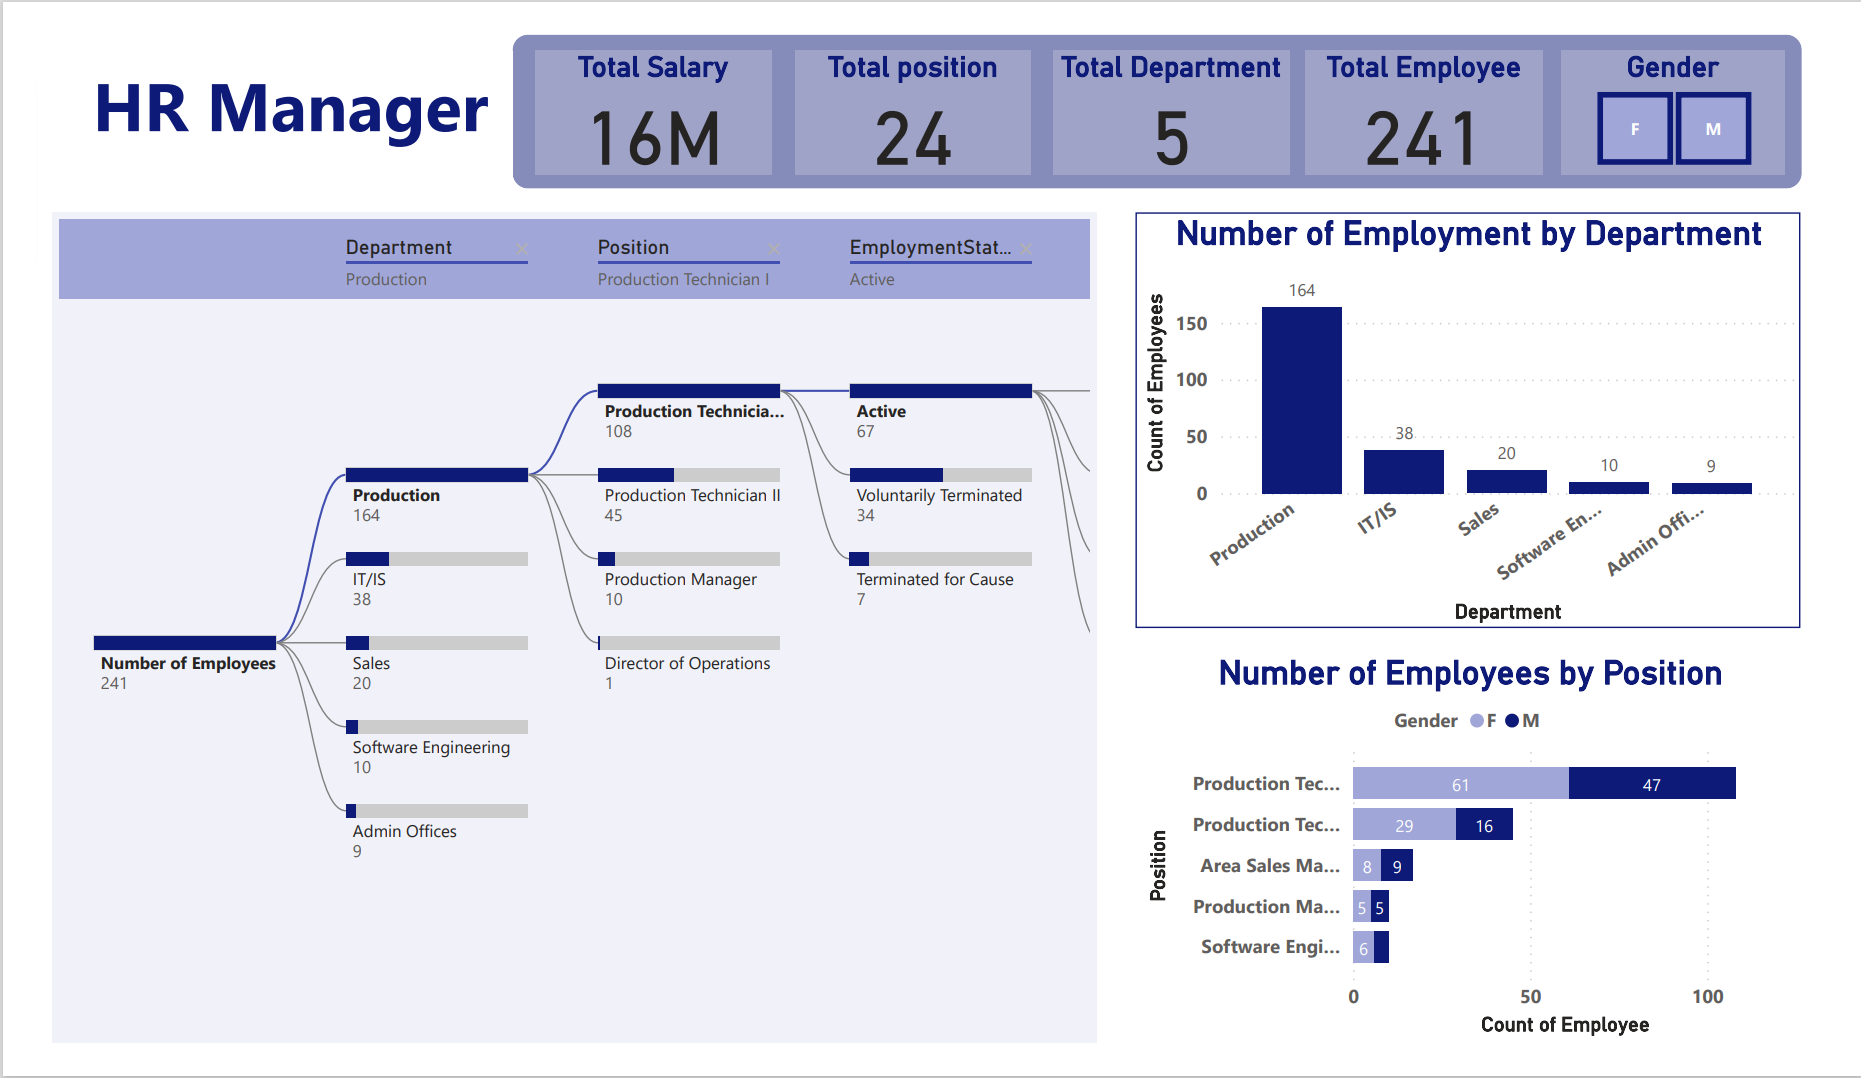
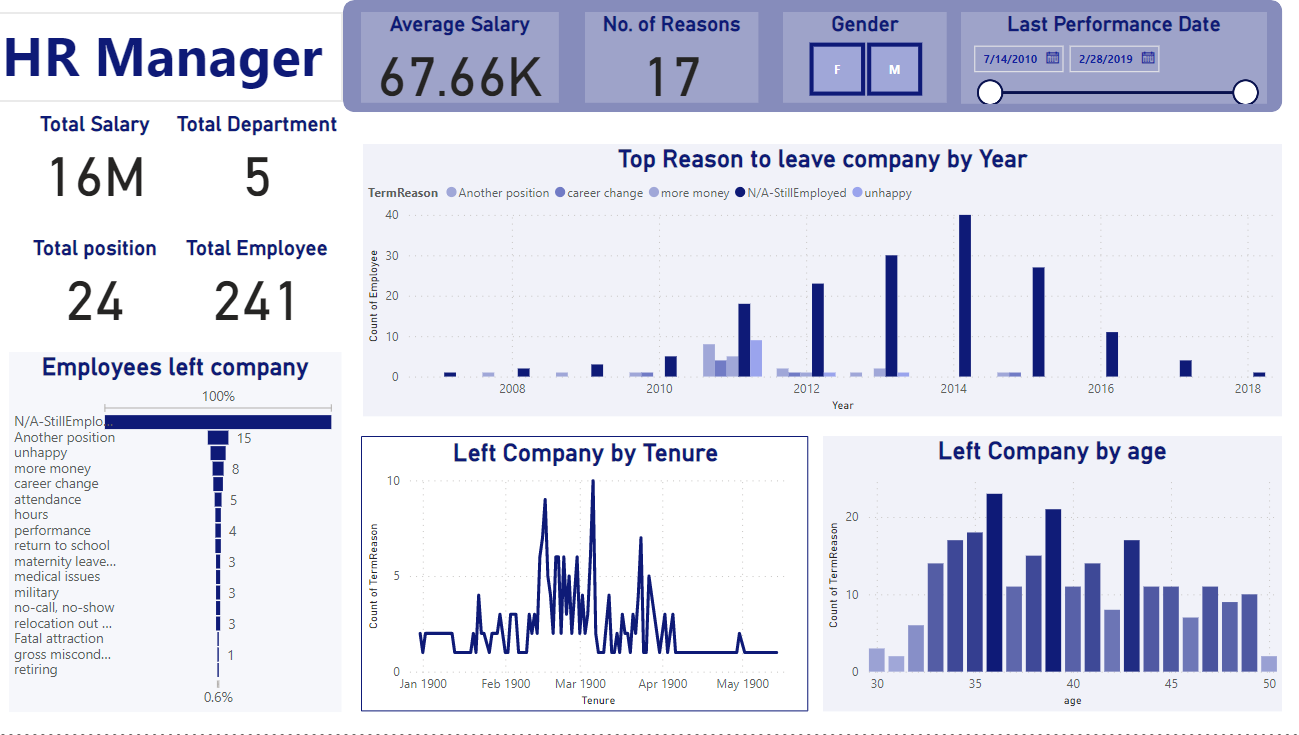
The HR Management Dashboard provides a user-friendly interface to explore and analyze employee data effectively. It offers deep insights into performance scores, salary trends, tenure distributions, and employee retention. The dashboard includes various visualizations, drill-through capabilities, and filters, making it easy for HR professionals to customize their analysis and make informed decisions.
Additional Filters
The HR Management Dashboard features multiple filtering options that allow users to customize their analysis:
🔹 Department Filter: View insights specific to HR, IT, Sales, Finance, etc.
🔹 Position Filter: Analyze data based on job roles (Manager, Analyst, Engineer, etc.)
🔹 Age Filter: Segment employees based on age groups to study generational trends
🔹 Gender Filter: Analyze workforce distribution and performance by gender
🔹 Salary Range Filter: Adjust salary bands to assess compensation trends
🔹 Employment Status Filter: Compare active employees vs. those who have left
🔹 Year of Hiring Filter: Track hiring trends for specific time periods
🔹 Employee Tenure Filter: View retention rates based on work tenure
🔹 Performance Score Filter: Study performance trends for different employee segments
🔹 Satisfaction Level Filter: Analyze employee satisfaction based on benefits and work environment
Visualization Types:
- Card Visuals