RecruitWise: Insightful Talent Matching Hub
Unlock Employee Insights for Smarter Workforce Decisions
Category :
Business Management
Powered by :
YbAISolution
Tool Used :
Power BI
Designer :
Bhrami Zadafiya
RecruitWise: Insightful Talent Matching Hub
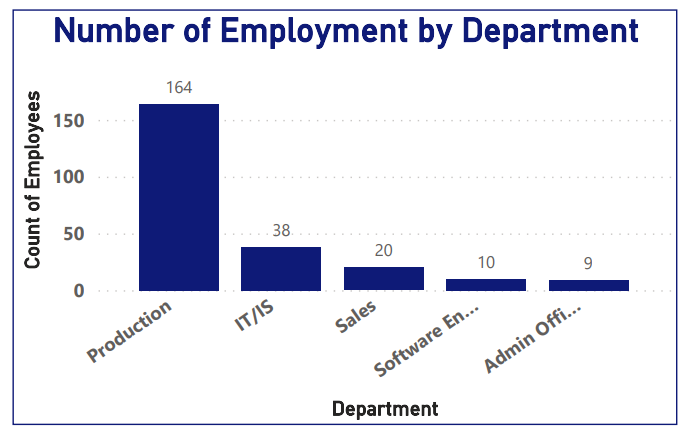
Employee Distribution by Department
This bar chart visualizes the number of employees across different departments within the organization. The production department has the highest workforce, with 164 employees, reflecting its critical role in operations. On the other hand, Software Engineering (10 employees) and Admin Office (9 employees) have the lowest staff count, indicating a lean team structure in these areas. This insight helps HR managers assess workforce distribution, identify staffing gaps, and make informed decisions about recruitment and resource allocation.
RecruitWise: Insightful Talent Matching Hub
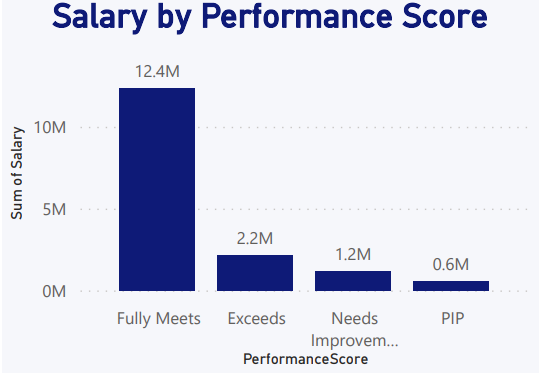
Salary Distribution by Performance Score
This visualization showcases the total salary allocation based on employee performance scores. Employees who "Fully Meet" expectations receive the highest total salary, amounting to $12.4M, indicating a strong alignment between compensation and consistent performance. Conversely, employees rated as "Exceeds" ($2.2M), "Needs Improvement" ($1.2M), and those under a Performance Improvement Plan (PIP) ($0.6M) receive significantly lower total salaries. This pattern reflects the organization's performance-driven compensation strategy, where higher ratings correlate with greater salary allocation. This insight helps HR teams analyze compensation fairness, reward structures, and identify areas for potential salary adjustments or performance improvement initiatives.
RecruitWise: Insightful Talent Matching Hub
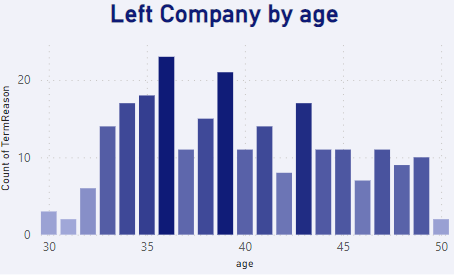
Employee Attrition by Age
This bar chart illustrates the distribution of employees who have left the company across different age groups. The highest attrition is observed at ages 30, 31, and 50, indicating potential trends in career transitions, job dissatisfaction, or retirement planning. Understanding age-based attrition helps HR managers identify patterns, such as mid-career shifts or retirement-related exits, allowing them to implement targeted retention strategies, succession planning, and employee engagement initiatives.
RecruitWise: Insightful Talent Matching Hub
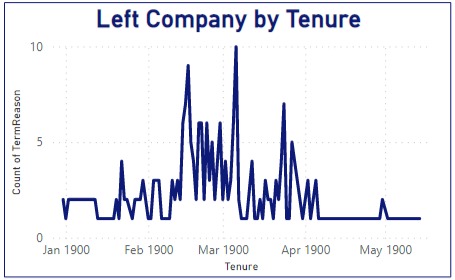
Employee Attrition by Tenure
This line graph illustrates the number of employees who left the company based on their tenure. The highest number of terminations occurred around a specific tenure range, indicating a critical period where employees are more likely to leave. There is a peak in terminations around a particular tenure, which could indicate challenges related to job expectations, career growth, or company policies. Lower termination counts at the beginning and end of the tenure range suggest either strong retention initially or employees staying long-term before retirement or voluntary exits.