This Power BI dashboard project, titled AGRIROBOT, leverages an agricultural dataset to analyze and visualize crop yields per hectare in relation to environmental factors, soil profiles, irrigation methods, fertilizers, and pesticides. The goal is to empower farmers, agronomists, and policymakers with data-driven insights to improve crop productivity, choose optimal agricultural practices, and boost sustainable farming.
AgriRobot Analysis
Category :
Agriculture
Powered by :
YBAISolution
Tool Used :
Power BI
Designer :
Bhrami Zadafiya
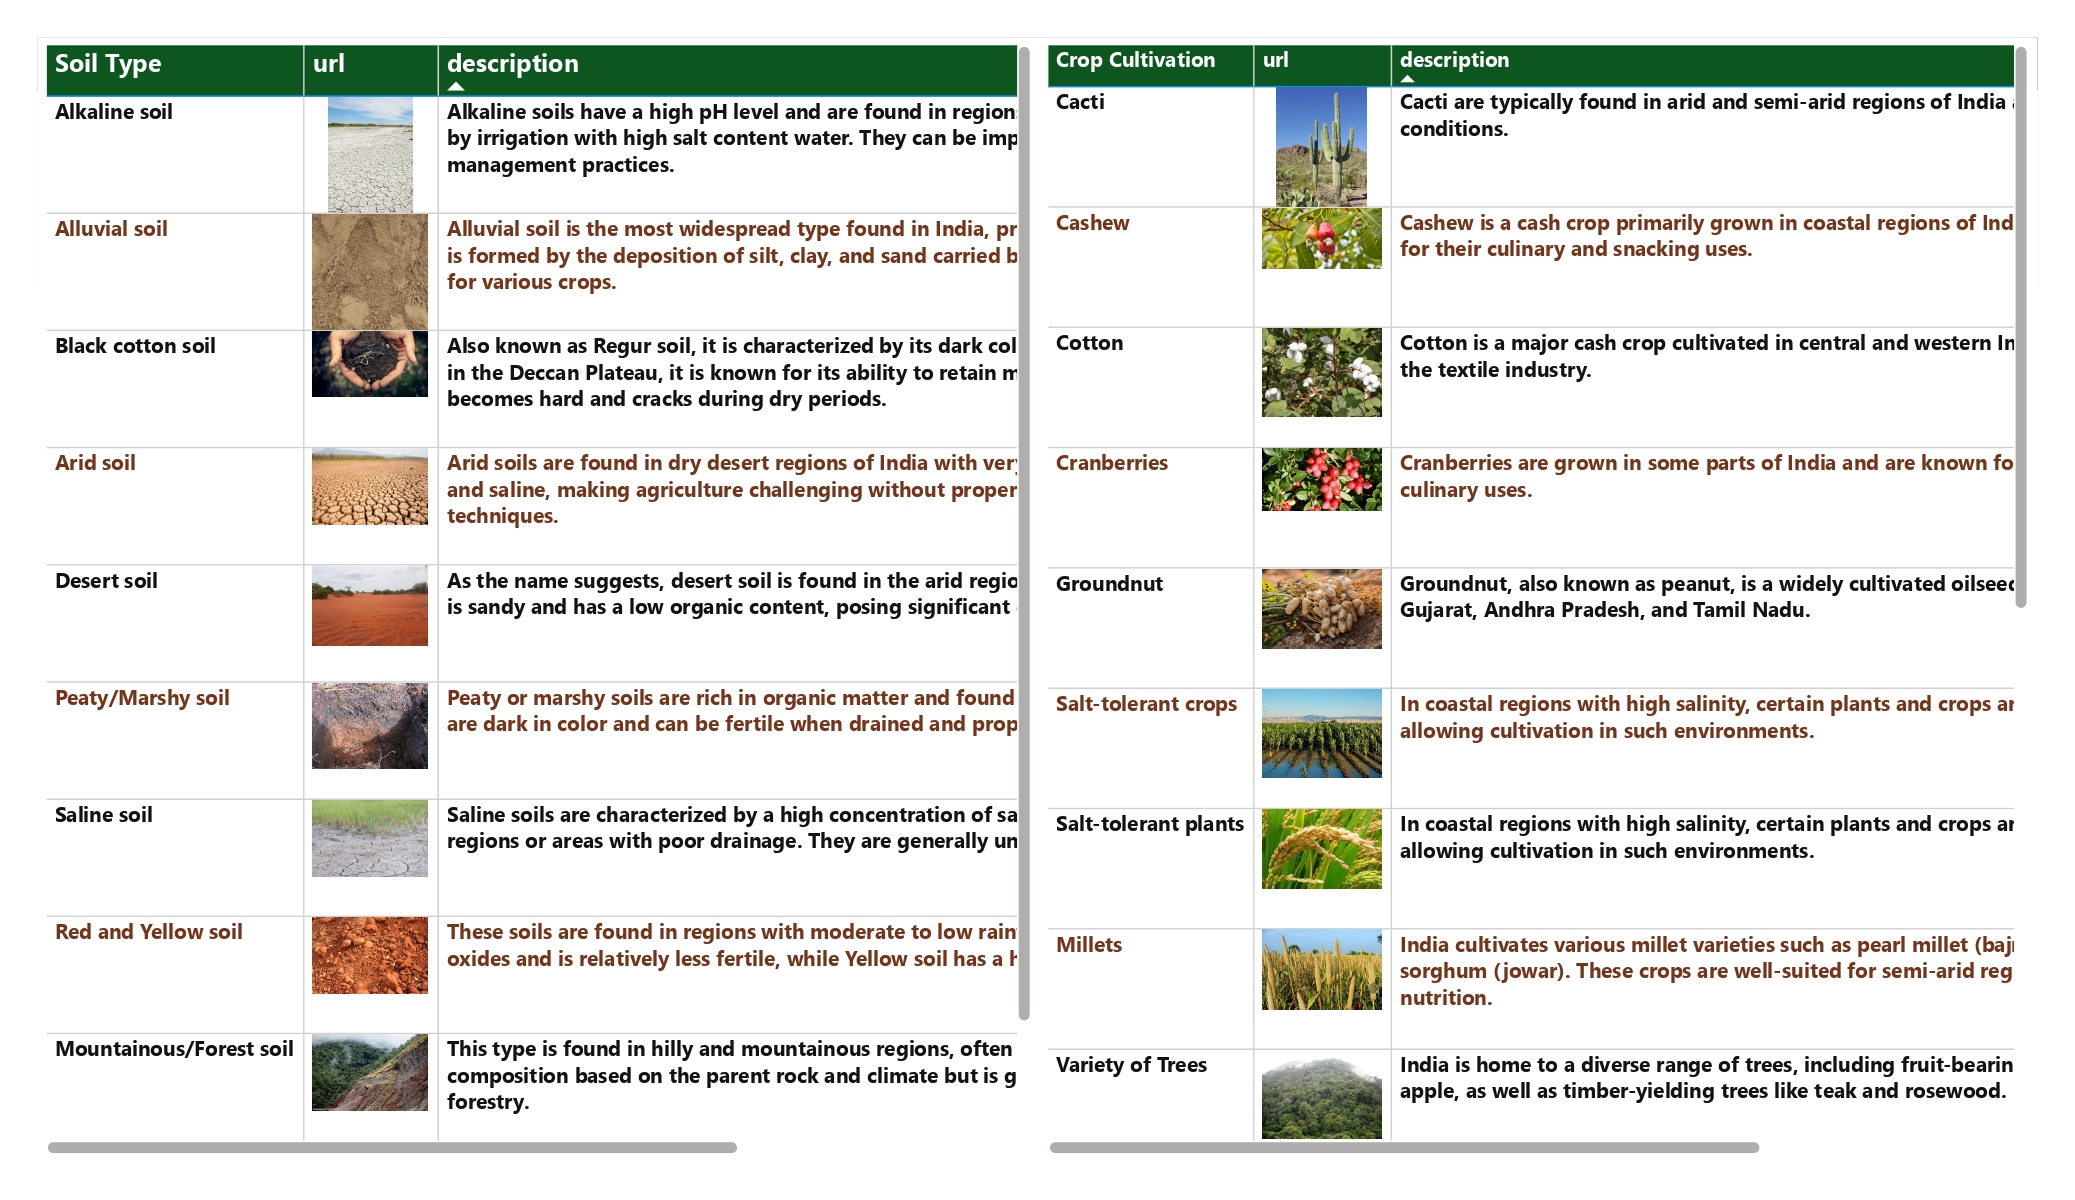
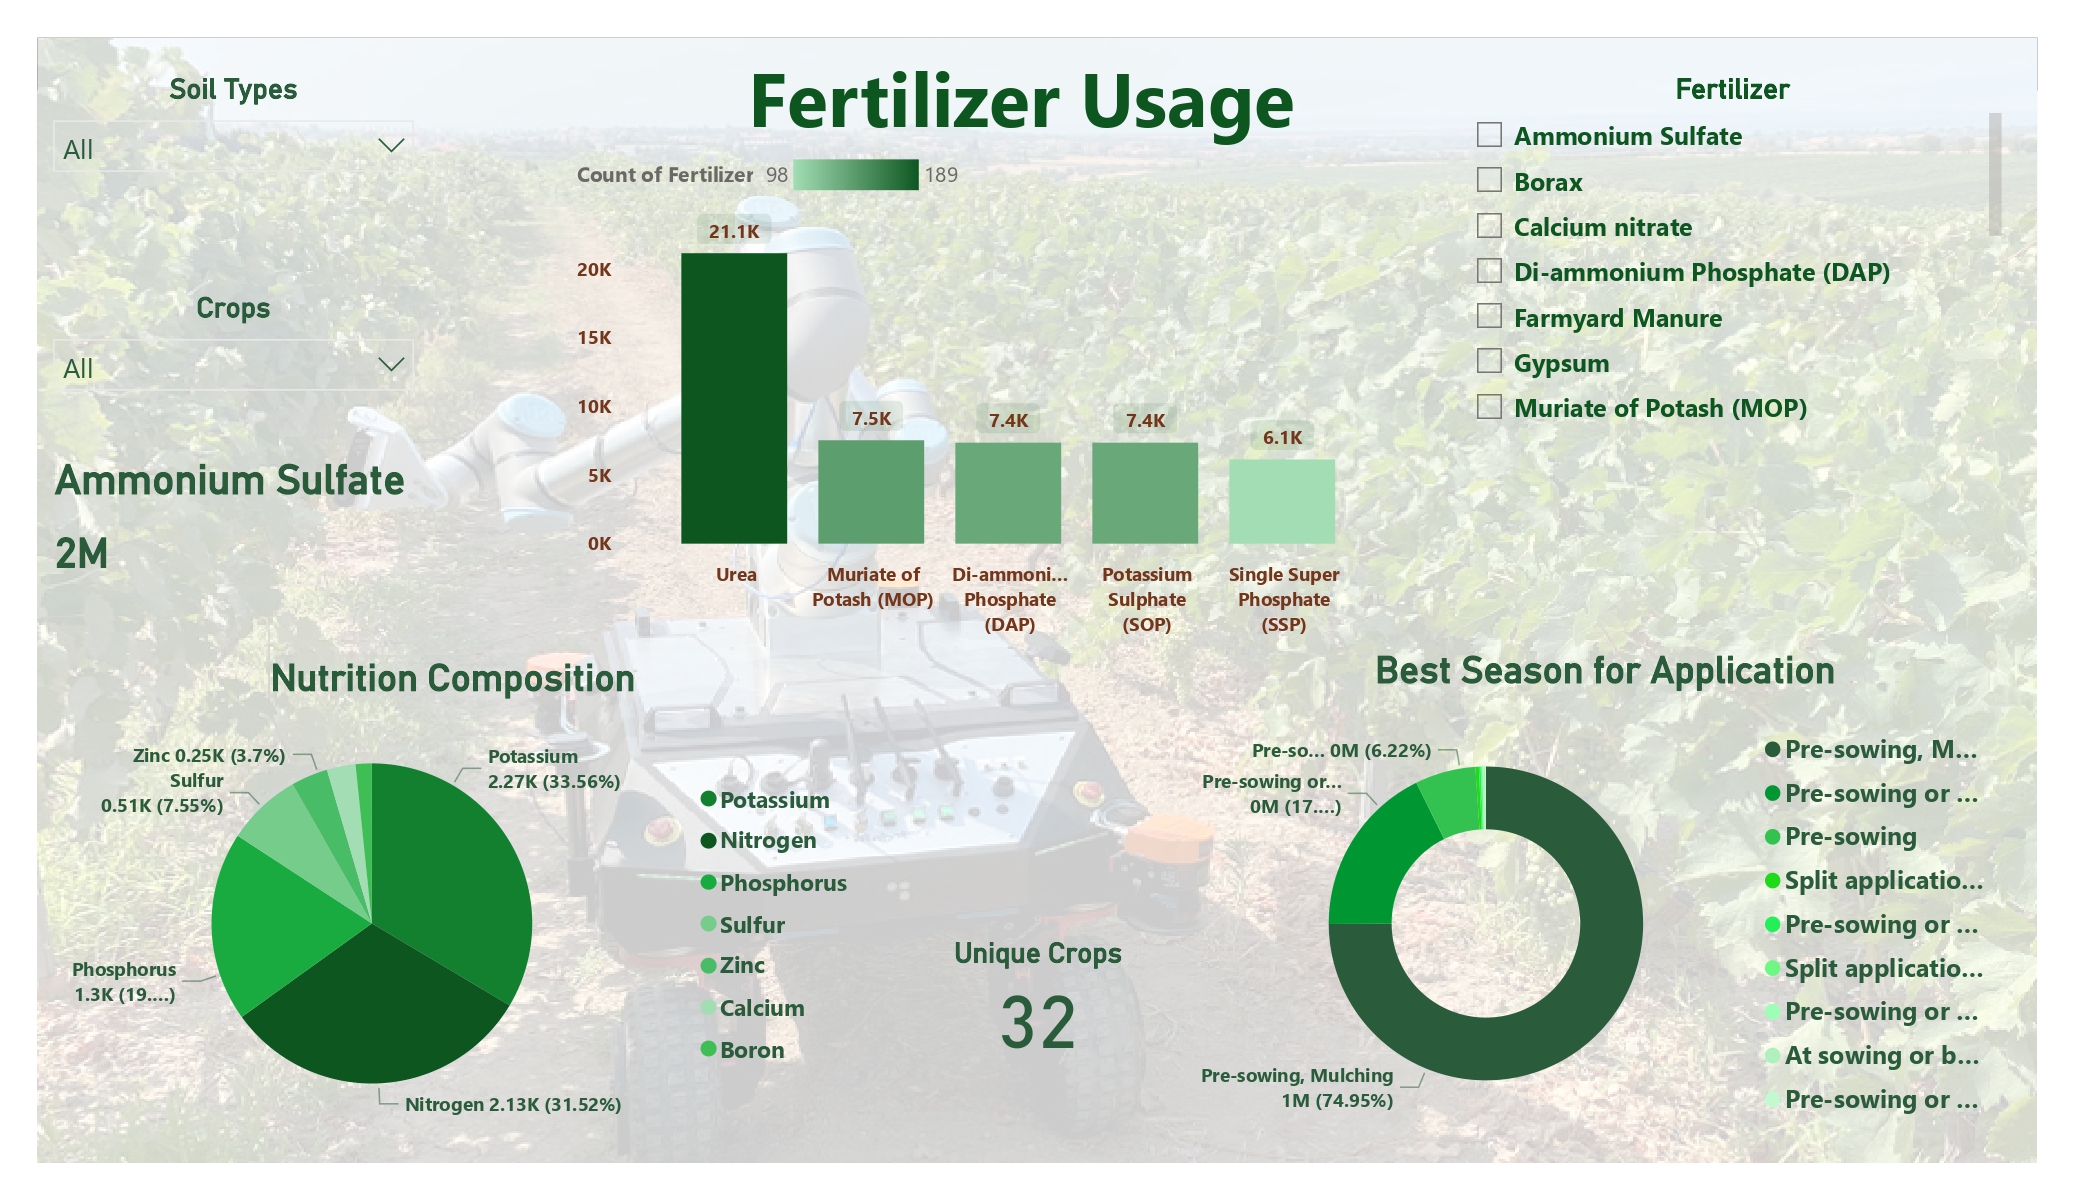
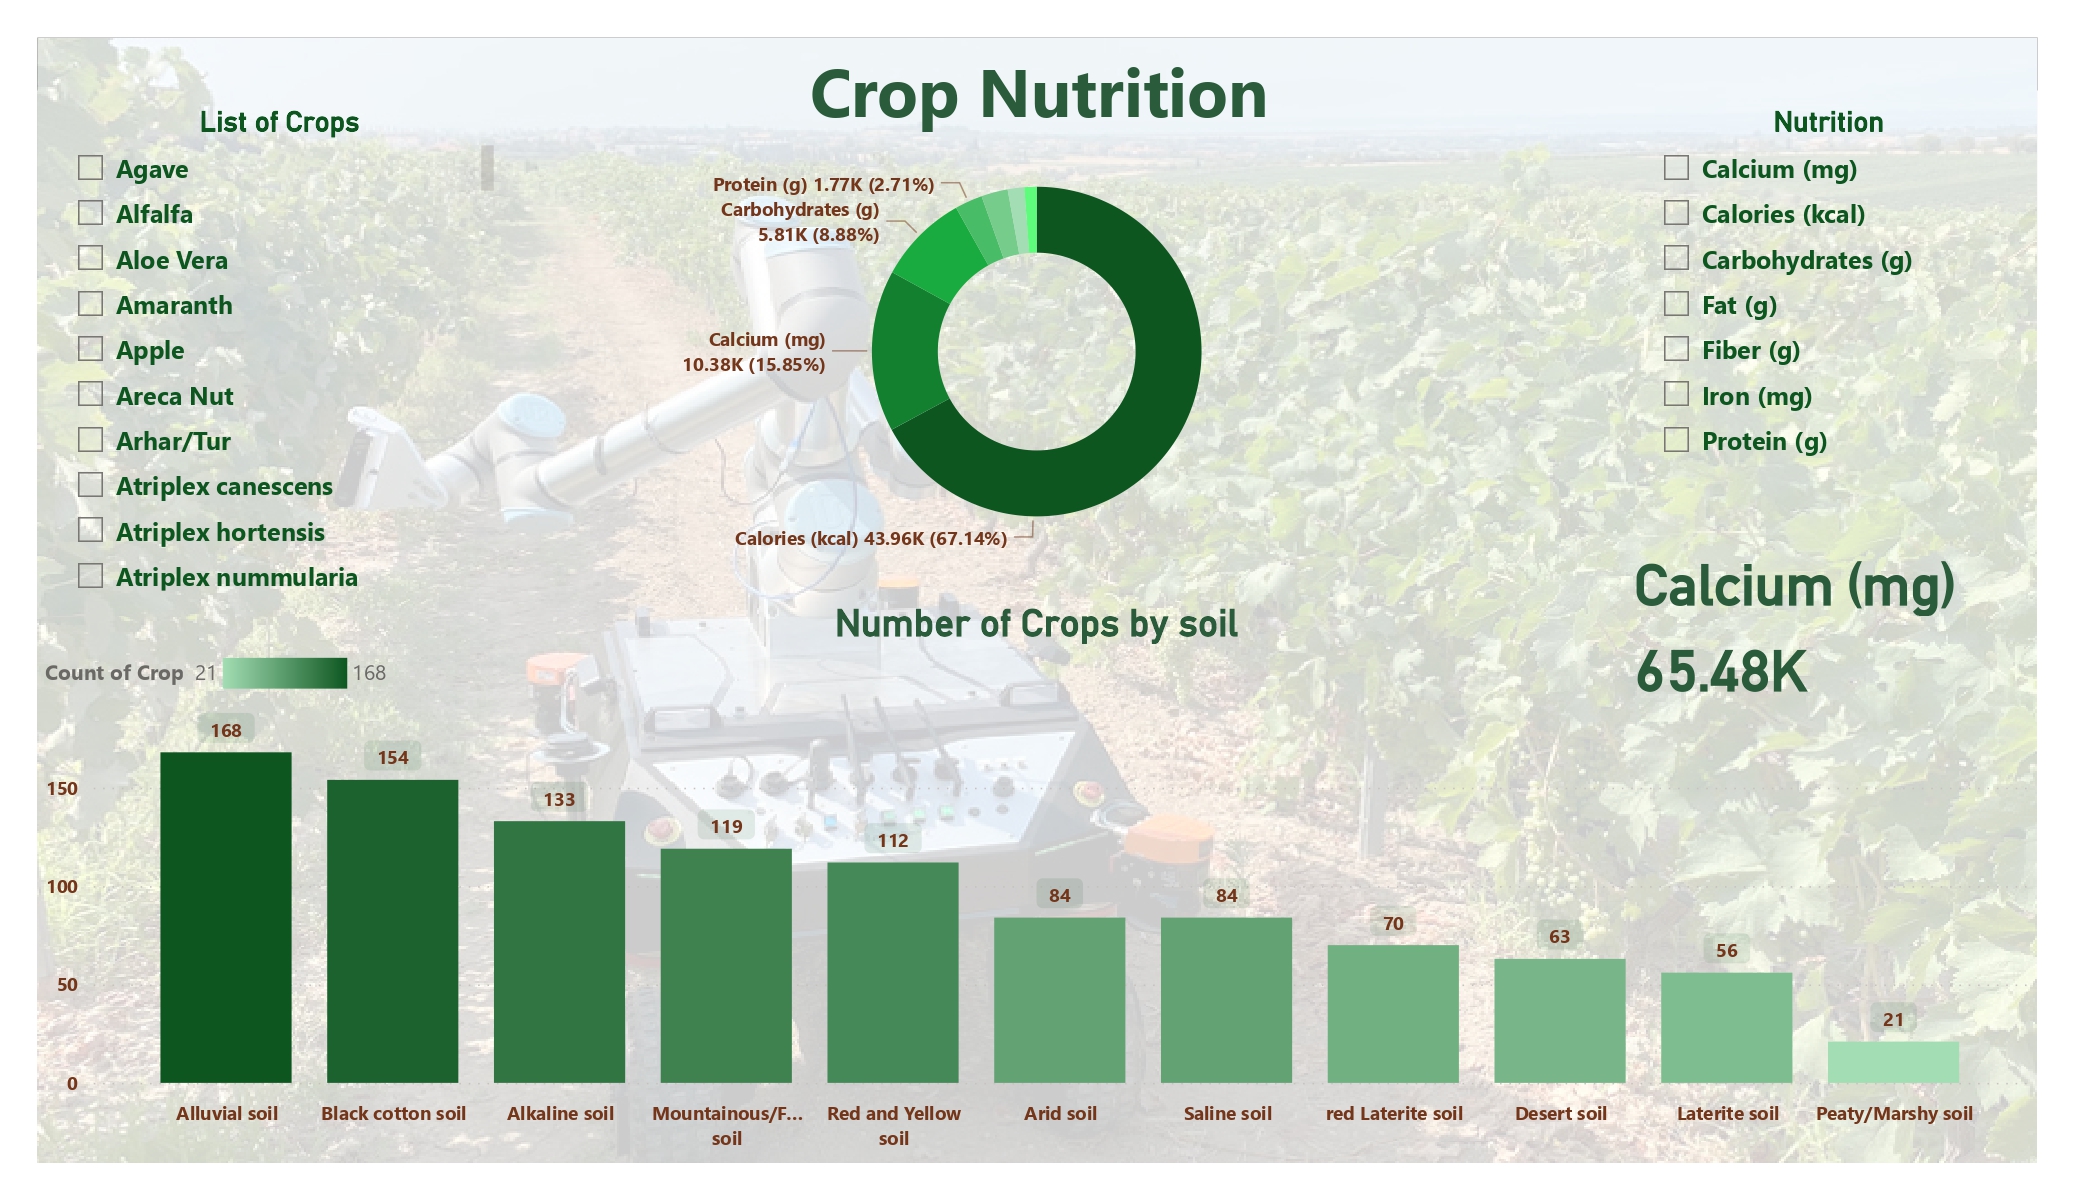
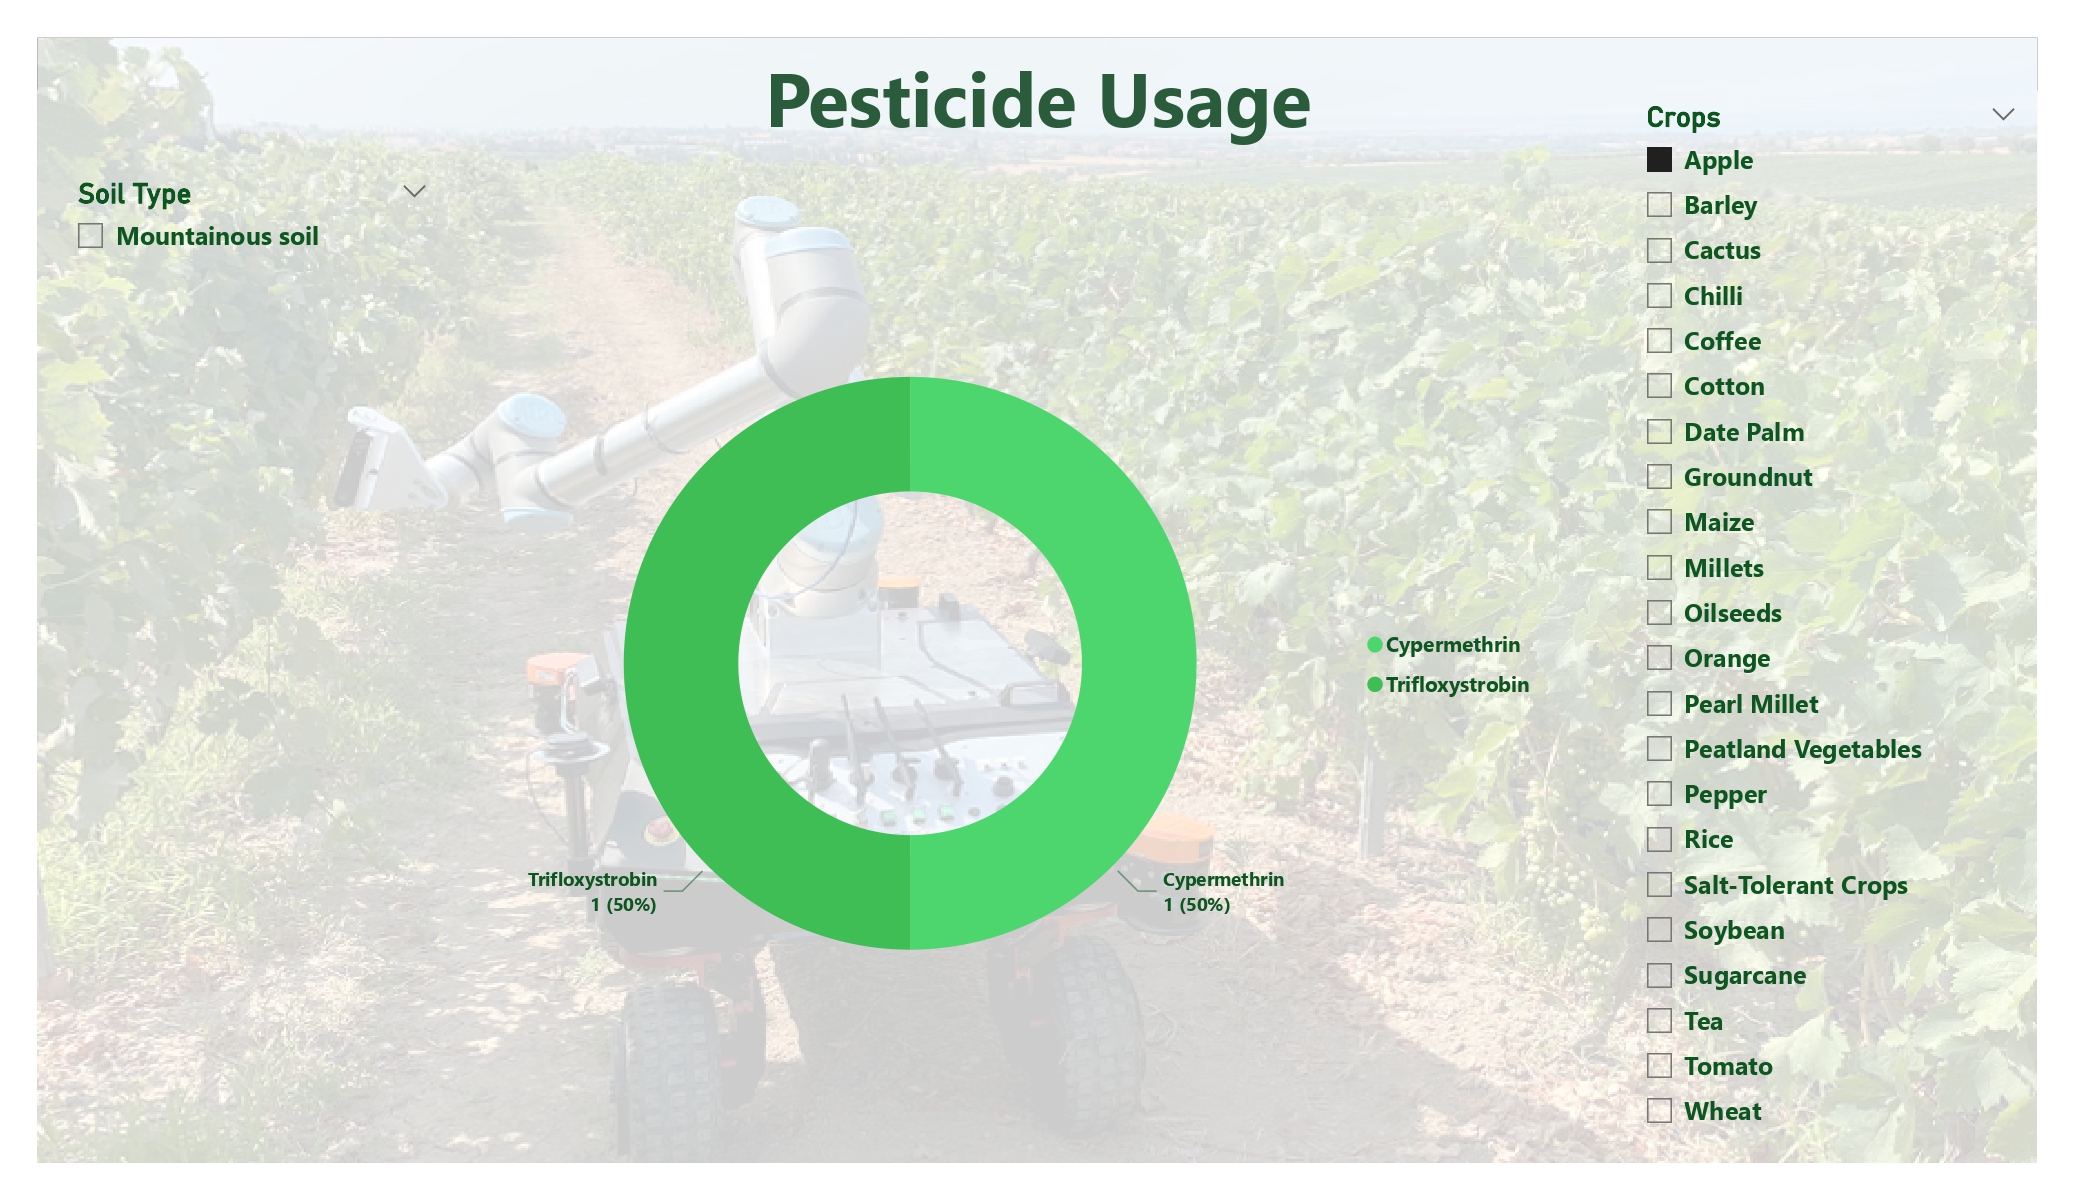
The dashboard offers a comprehensive and interactive visual platform that showcases key aspects of agricultural data, including the distribution of crops by soil type, patterns in fertilizer and pesticide usage, and the nutritional composition of various crops. It also highlights seasonal best practices for applying fertilizers, allowing users to explore the most effective timing for different agricultural inputs. Additionally, it maps the relationships between soil types, crops, and agricultural inputs such as fertilizers and pesticides. This integrated view enables stakeholders to identify high-yield practices, determine soil suitability for specific crops, and evaluate the overall effectiveness of different agricultural techniques.
Additional Filters
Soil Type Filter: Allows selection of specific soil types (e.g., Alluvial, Black Cotton, Desert, Red & Yellow, etc.)
Crop Filter: Enables focusing on specific crops (e.g., Apple, Groundnut, Millets)
Fertilizer Filter: Drill down on fertilizer types used and their frequency
Best Season for Application Filter: View fertilizer effectiveness by season (e.g., Pre-sowing, Mulching)
Visualization Types:
- Card Visuals
- Tables / Lists
- KPI Cards / Value Tiles