AgriRobot Analysis
Category :
Agriculture
Powered by :
YBAISolution
Tool Used :
Power BI
Designer :
Bhrami Zadafiya
AgriRobot Analysis
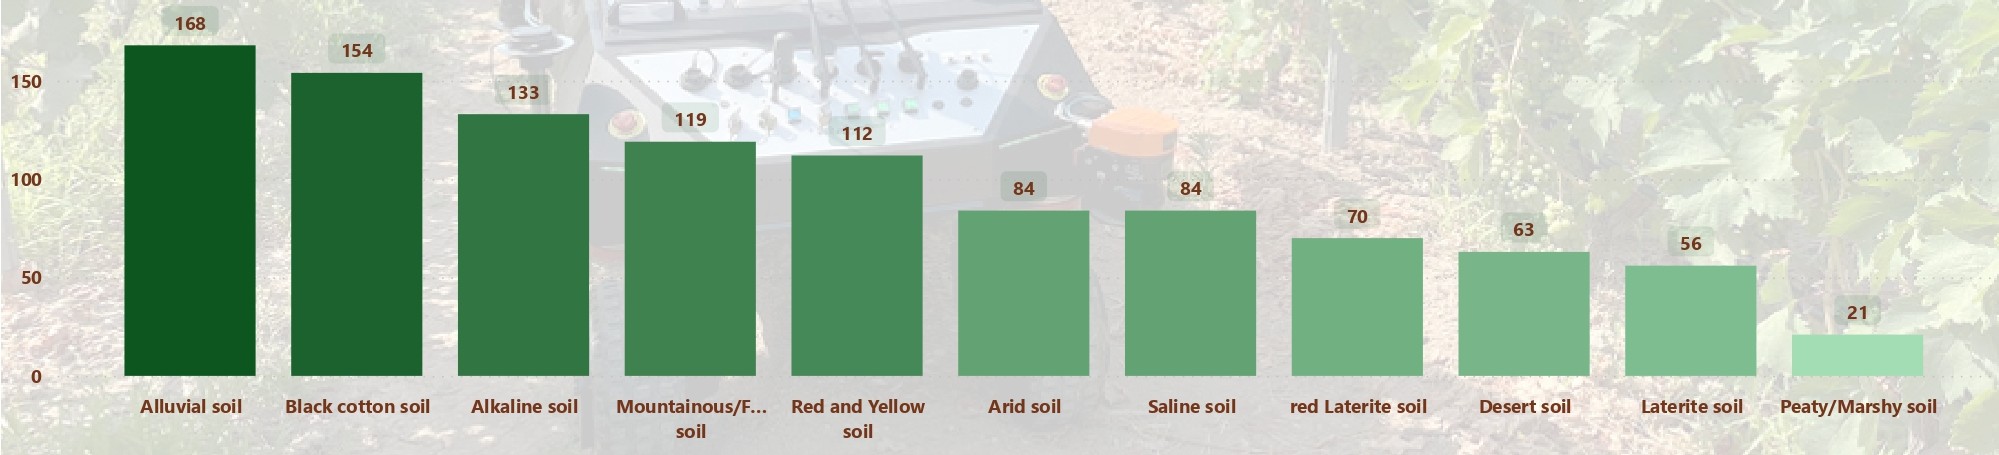
Number of Crops by Soil Type
This bar chart shows how many different crops are supported by each soil type. Alluvial soil supports the highest number of crops (168), followed by Black Cotton soil (154). In contrast, Desert and Peaty/Marshy soils support fewer crops, indicating limitations due to low fertility or poor water retention. This insight helps identify the most versatile and agriculturally productive soil types.
AgriRobot Analysis
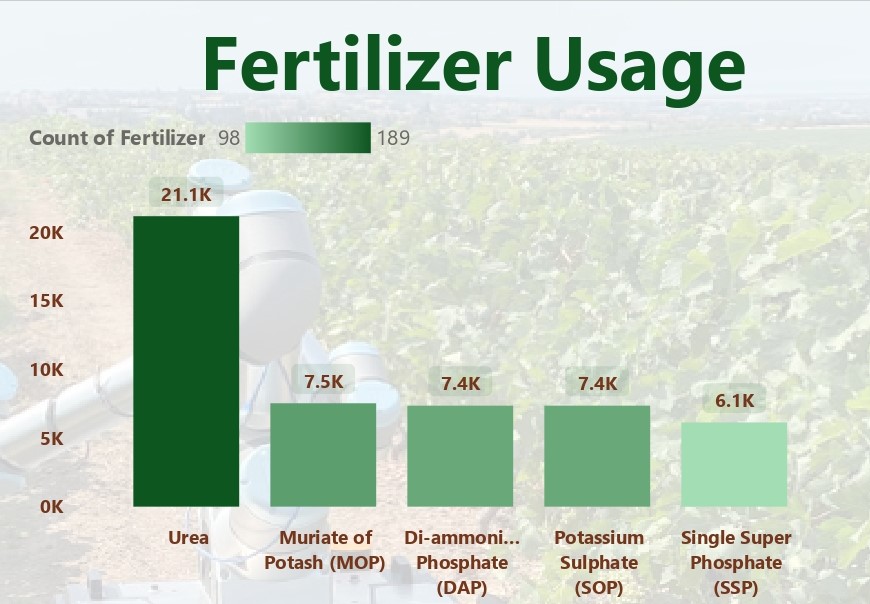
Fertilizer Usage Count
A bar graph visualizes the frequency of use for different fertilizers. Urea ranks highest in usage (21.1K), followed by DAP, MOP, SOP, and SSP. This indicates a preference for nitrogen-rich fertilizers in farming practices and highlights which inputs are most relied upon for boosting crop growth.
AgriRobot Analysis
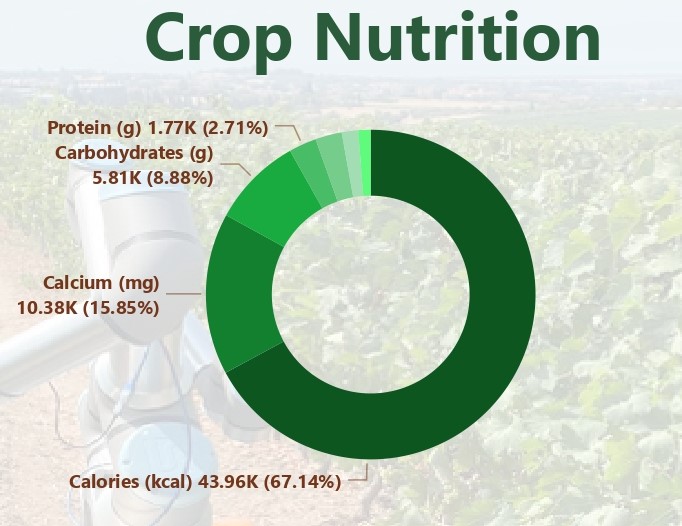
Nutrient Composition of Crops
This section use pie chart to display the total nutritional values—such as calories, protein, calcium, and carbohydrates—across all crops. For instance, the total calories recorded reach 43.96K kcal, showcasing crops rich in energy. This insight helps evaluate the nutritional output of cultivated crops and supports dietary planning or market value analysis.
AgriRobot Analysis
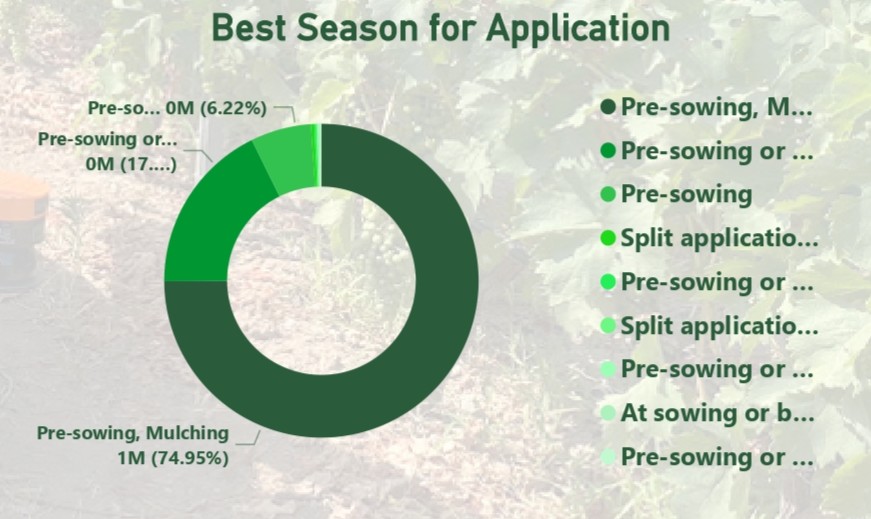
Best Season for Fertilizer Application
A pie chart reveals that a majority (74.95%) of fertilizers are applied during the pre-sowing phase. This insight emphasizes the critical role of early fertilization in crop development and yield optimization. It guides farmers to align their practices with seasons for maximum efficiency.
AgriRobot Analysis
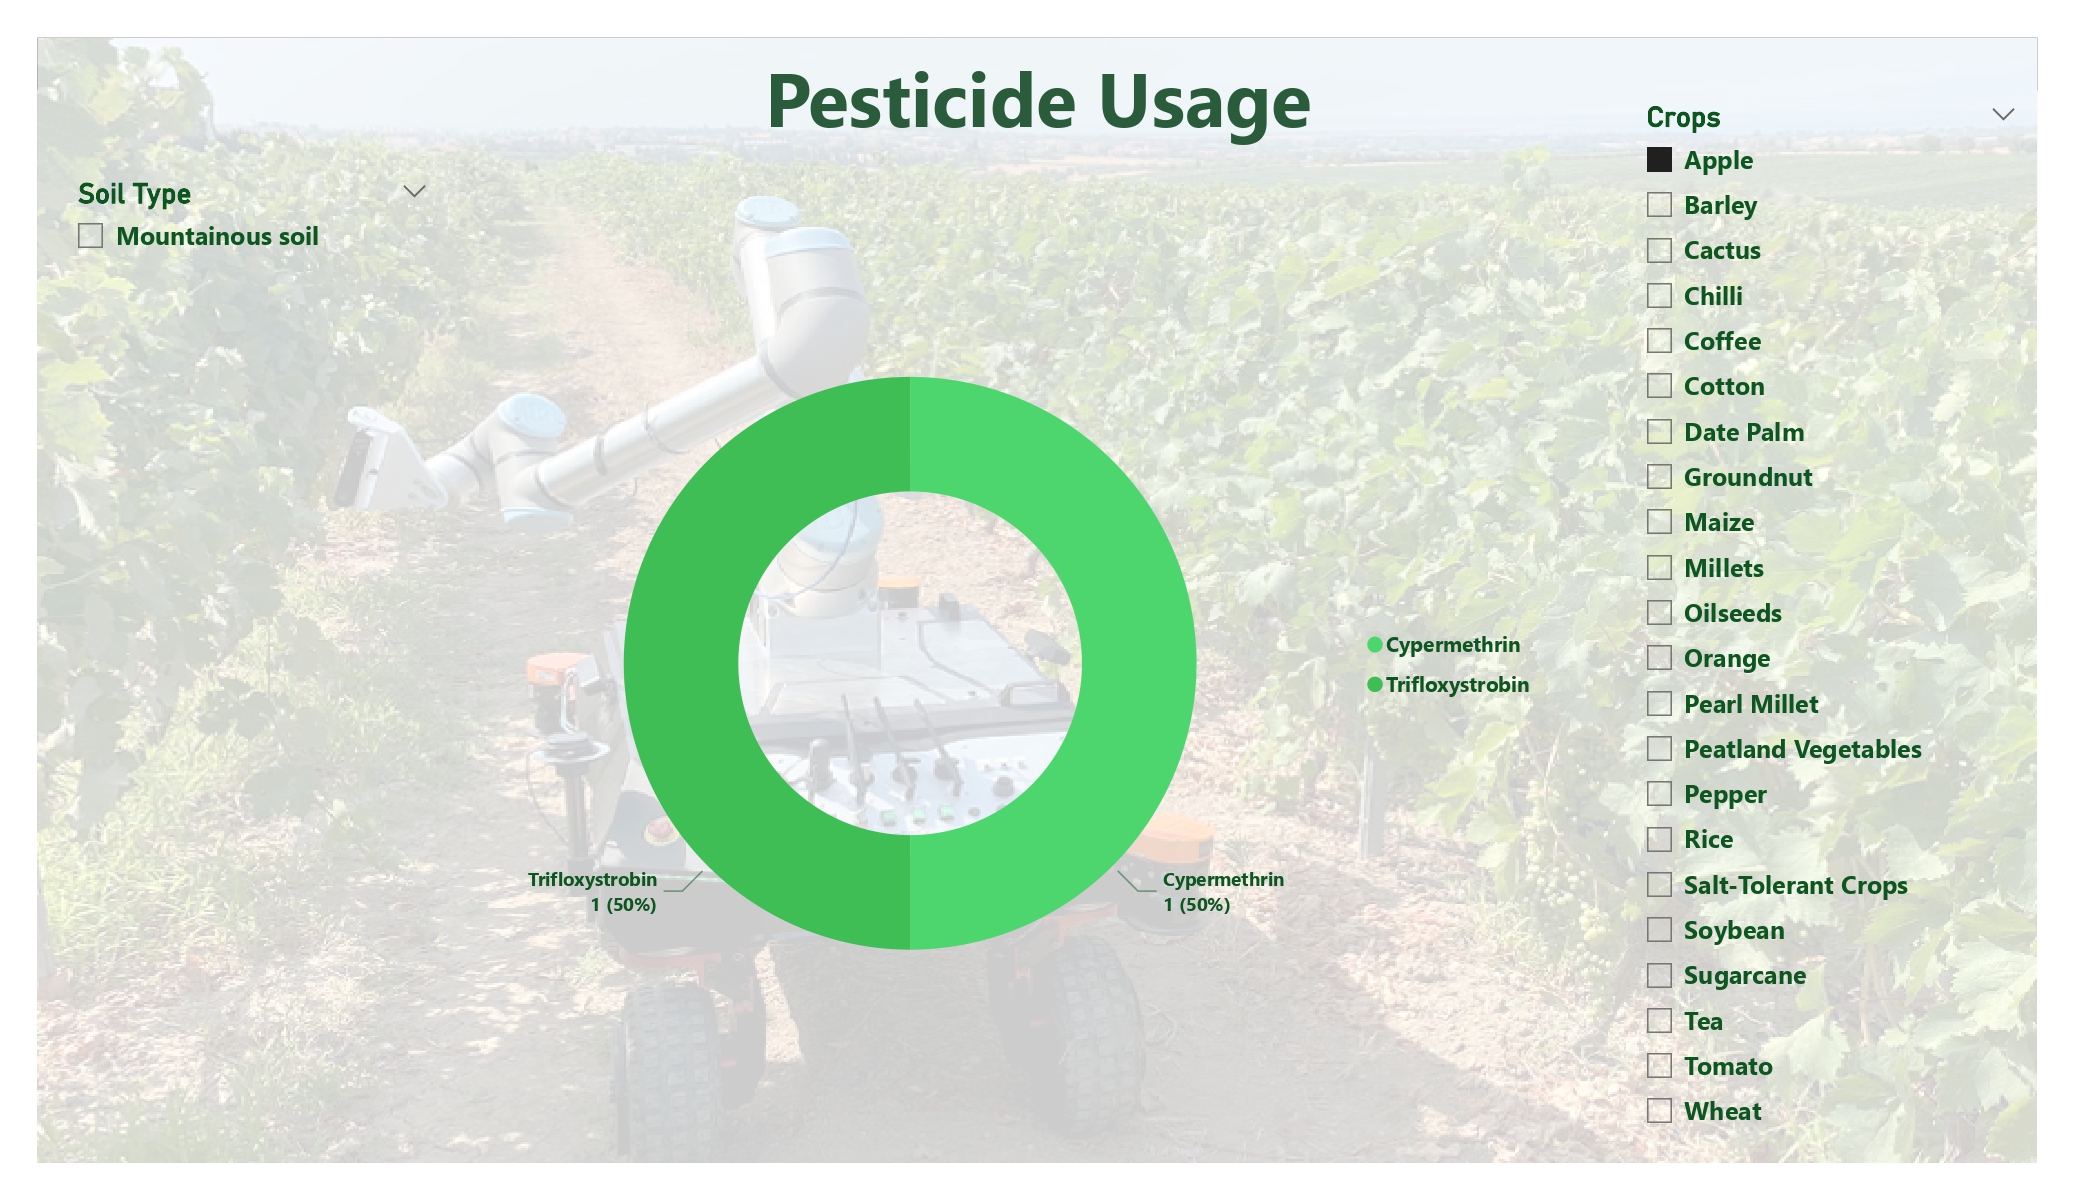
Pesticide Usage Distribution
This insight shows a 50-50 split between the use of Cypermethrin and Trifloxystrobin, displayed via a donut or bar chart. It suggests that both pesticides are equally preferred and likely target different pests or crop types, indicating a balanced pest management strategy.