Hospital Data Insights
Category :
Healthcare
Powered by :
YBAISolution
Tool Used :
Power BI
Designer :
Bhrami Zadafiya
Hospital Data Insights
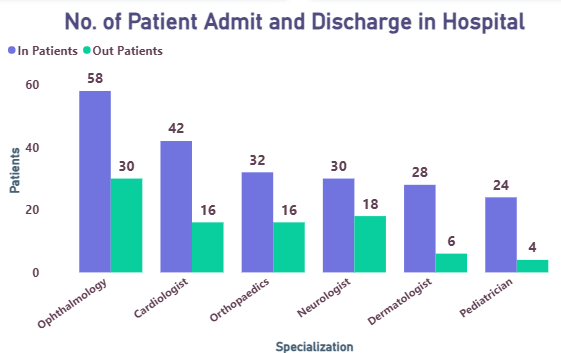
No. of Patient Admit and Discharge in Hospital
This bar chart illustrates the distribution of in-patients and out-patients across various hospital specializations. The blue bars represent in-patients (admitted), while the green bars indicate out-patients (discharged). Ophthalmology has the highest number of patients, with 58 in-patients and 30 out-patients, suggesting high demand for specialized eye care Pediatrics has the lowest figures (24 in-patients, 4 out-patients), likely due to the nature of pediatric cases requiring extended care.
Hospital Data Insights
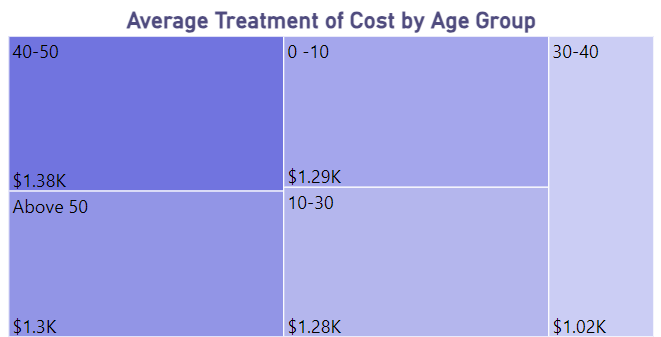
Analysis of Average Treatment Cost by Age Group
This tree map chart illustrates the average treatment cost for different age groups, highlighting cost variations across patient demographics. The highest average treatment cost is for the 40-50 age group ($1.38K), indicating higher medical expenses for this demographic. Children (0-10) and young adults (10-30) have similar treatment costs ($1.29K and $1.28K, respectively). The 30-40 age group has the lowest treatment cost ($1.02K), potentially due to fewer severe health conditions in this age range.
Hospital Data Insights
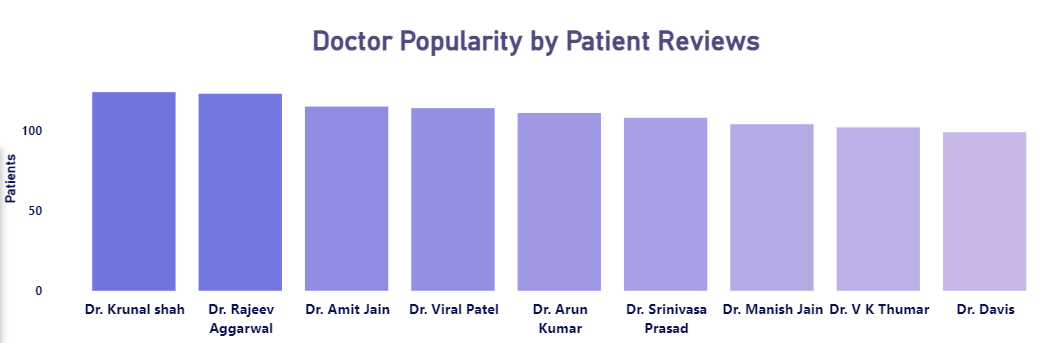
Analysis of Doctor Popularity by Patient Reviews
This bar chart represents the popularity of doctors based on patient reviews, measured by the number of patients they have attended or received feedback from. Dr. Krunal Shah and Dr. Rajeev Aggarwal have the highest patient reviews, indicating strong popularity and trust among patients. DASHBOARD ANALYSIS SHRUTI ZALAVADIYA 9 Dr. Srinivasa Prasad, Dr. Manish Jain, Dr. V K Thumar, and Dr. Davis have relatively fewer reviews, but still maintain a significant patient base.
Hospital Data Insights
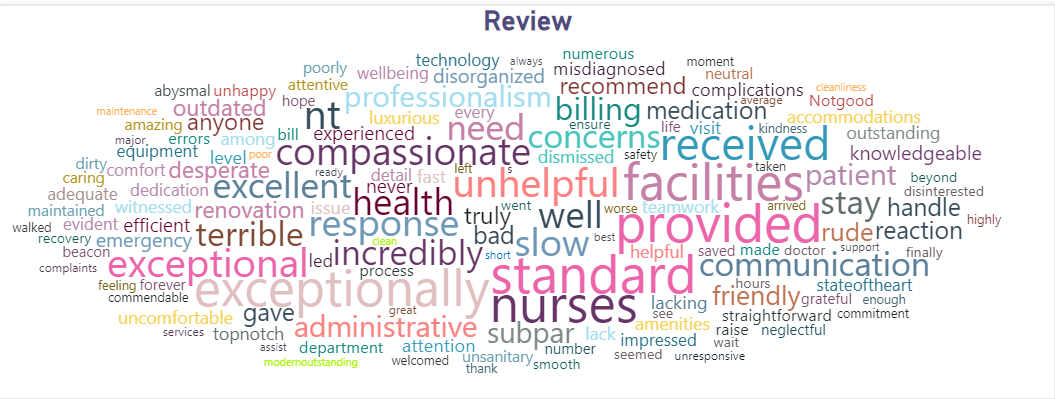
Analysis of review
This word cloud highlights the most frequently mentioned words in patient reviews, helping identify key themes related to healthcare experiences. Words like "exceptional," "excellent," "professionalism," "compassionate," "efficient," "knowledgeable," and "friendly" indicate that many patients appreciate the quality of care, nursing staff, and overall service. Words like "unhelpful," "slow," "rude," "neglectful," "terrible," and "subpar" indicate common complaints about staff behavior, response time, and service quality.
Hospital Data Insights
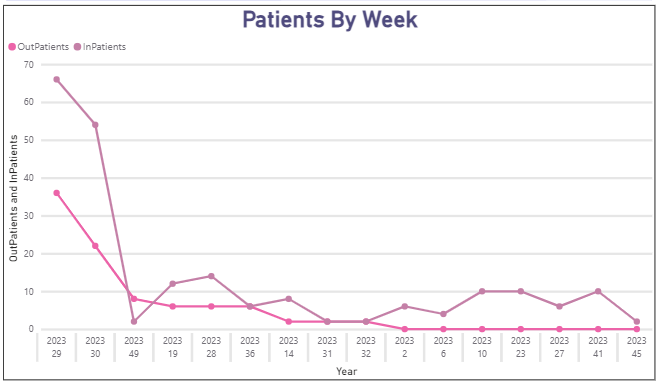
Patients By Week
This graph titled "Patients by Week" is a line chart comparing the weekly number of OutPatients and InPatients over a period of time in the year 2023. X-Axis (Horizontal): Represents the Year and Week number (e.g., 2023 Week 29, Week 30, ..., Week 45). Y-Axis (Vertical): Indicates the number of OutPatients and InPatients. Pink line with circles: OutPatients and Purple line with circles: InPatients. Both OutPatients (≈66) and InPatients (≈36) were very high in the initial weeks.
Hospital Data Insights
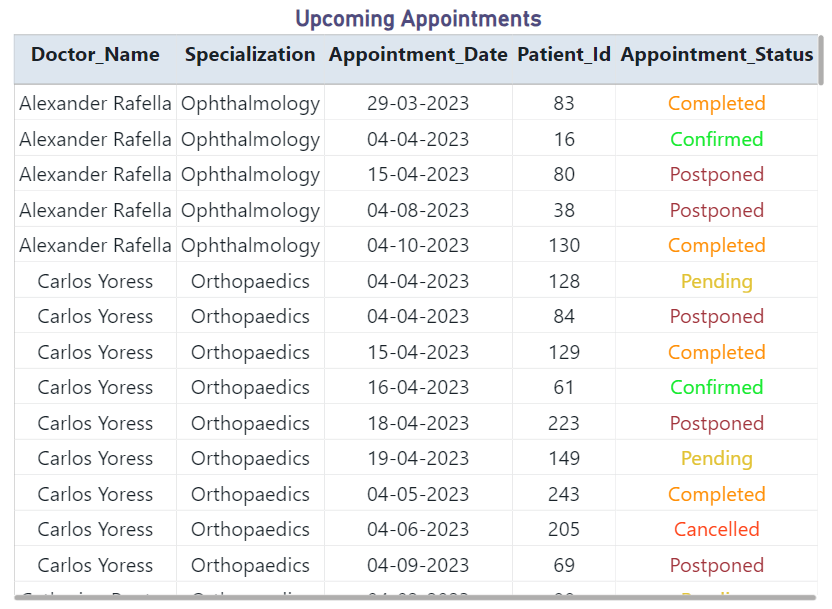
Upcoming Appointments
This is a tabular widget showing upcoming and recent appointments with the following details: Doctor Name, Specialization, Appointment Date, Patient ID, Appointment Status (e.g., Completed, Confirmed, Postponed, Pending). This view helps the administration or doctors track and manage patient appointments effectively.