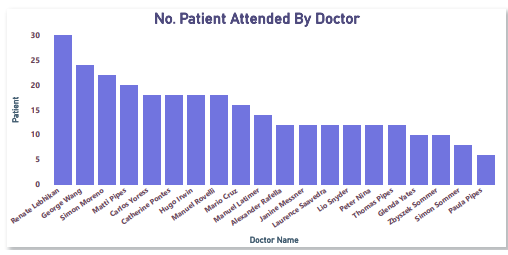
Doctors like Renate Lebhikan and George Wang treated the most patients, providing an overview of staff workload distribution.
Hospital Data Insights
Category :
Healthcare
Powered by :
YBAISolution
Tool Used :
Power BI
Designer :
Bhrami Zadafiya
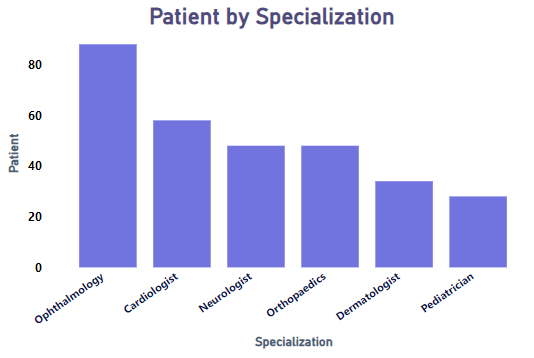
Ophthalmology and Cardiology departments serve the highest number of patients, reflecting demand trends and hospital focus areas.
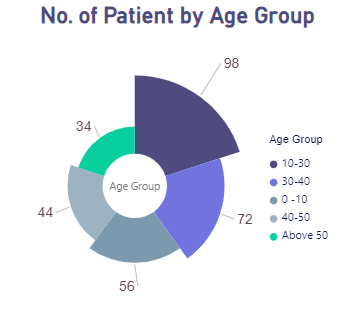
Most patients fall within the 10–30 and 30–40 age brackets, highlighting the primary demographic of hospital users.
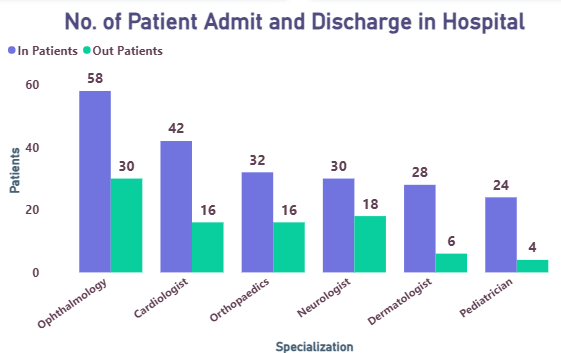
Ophthalmology shows the highest in-patient and out-patient split, while specializations like Neurology and Dermatology have lower discharge volumes, helping to compare department effectiveness.
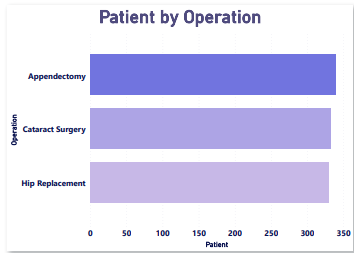
Appendectomy is the most frequently performed operation, followed by Cataract Surgery and Hip Replacement, giving a comparative view of surgical services.
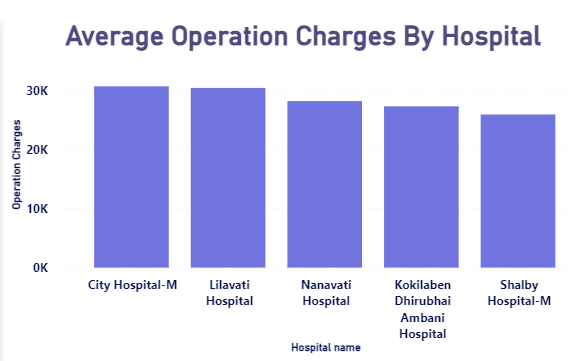
Lilavati Hospital and City Hospital-M charge significantly more than others, indicating pricing disparities among hospitals.
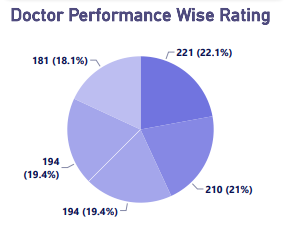
Doctors like Dr. Krunal Shah and Dr. Rajeev Aggarwal received the highest performance ratings, while feedback distribution helps pinpoint service quality gaps.
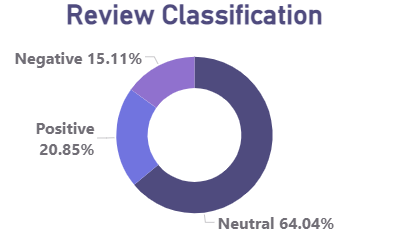
Sentiment analysis reveals that 64% of reviews are neutral, 20.8% positive, and 15.1% negative, suggesting opportunities to enhance the patient experience.
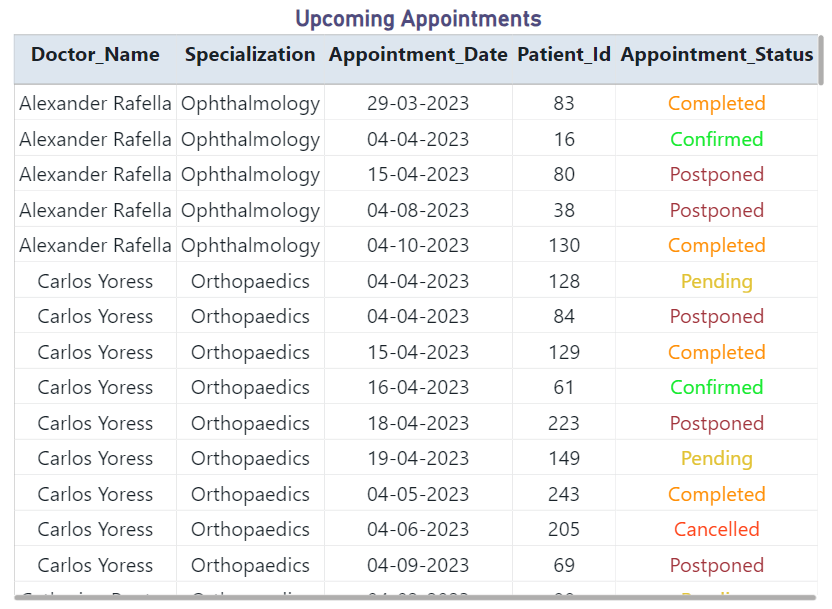
Upcoming and past appointments show the operational efficiency and highlight issues like frequent postponements and cancellations, especially under certain doctors.
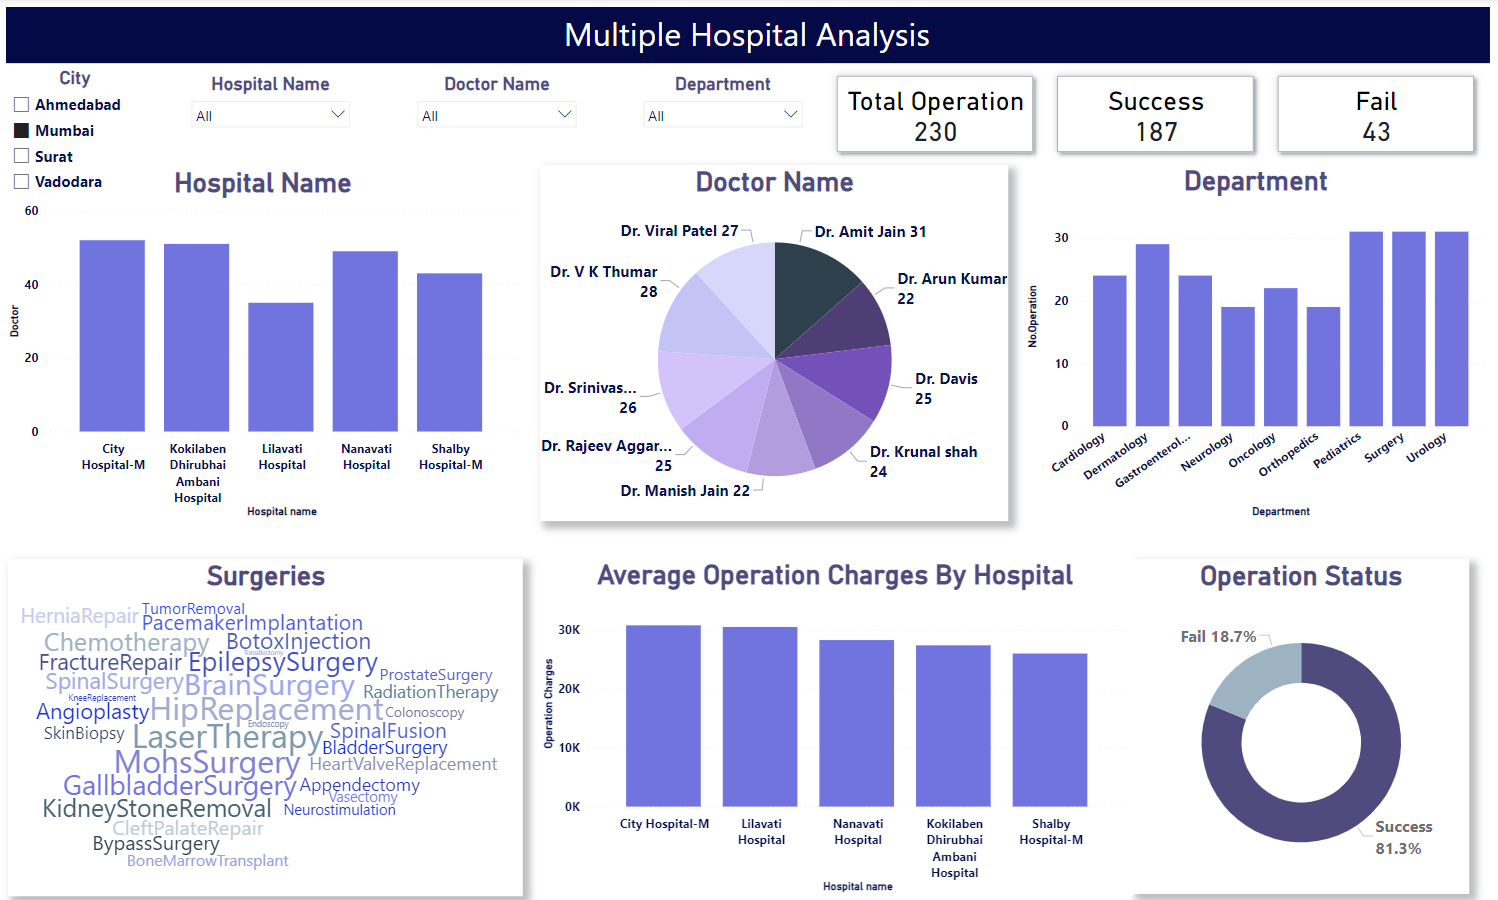
Departments like Cardiology, Orthopedics, and Neurology dominate operation counts, and their distribution across cities like Mumbai, Surat, and Vadodara supports regional healthcare planning. Hospitals like City Hospital-M and Nanavati have high doctor involvement, with doctors such as Dr. Amit Jain performing the most surgeries, giving a cross-hospital performance map.
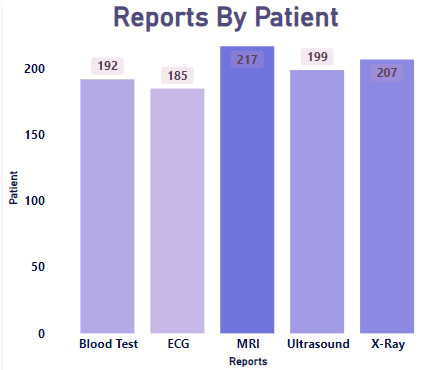
ECG and MRI reports are the most frequently ordered diagnostic tests, giving insight into the investigative focus of the hospital’s medical services.
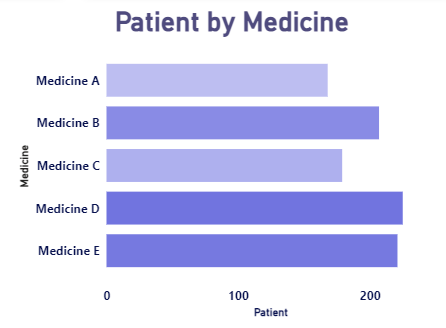
Medicine A and Medicine B are prescribed the most, which can inform pharmacy stock planning and drug usage patterns.