Ethnic Wear Dashboard
Unveiling Trends in Traditional & Cultural Fashion
Category :
Clothing
Powered by :
YbAISolution
Tool Used :
Power BI
Designer :
Bhrami Zadafiya
Ethnic Wear Dashboard
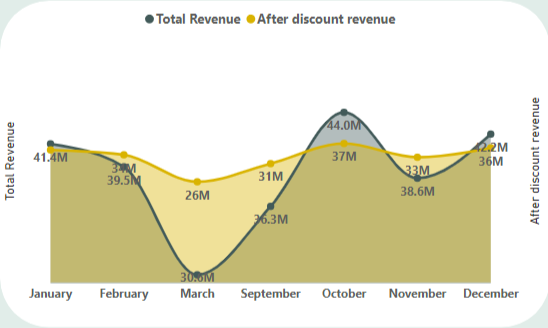
Monthly Revenue Trend: Total vs After Discount
It’s a line chart shows Monthly Revenue Trend: Total vs After Discount (in Millions) In October, the Total Revenue peaks at ₹44M, but After Discount Revenue drops to ₹37M, showing a ₹7M loss due to discounts — the highest among all months. While October brings in high sales (likely due to festive season), it’s also the month with the highest discounting impact. High sales volume is dependent on discounting in October. Test lowering discounts or offering value deals to sustain revenue while reducing margin impact. Focus on premium products or bundling to increase post-discount profitability.
Ethnic Wear Dashboard
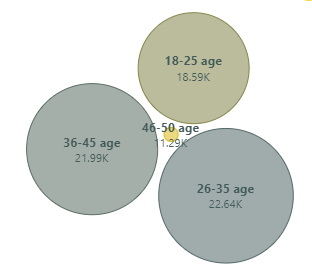
Age Group Purchase Patterns
It’s a bubble chart showing purchases by age group. The 26–35 age group contributes the most to ethnic wear purchases with ₹22.64K, followed closely by the 36–45 group at ₹21.99K. The 18–25 age group shows moderate engagement at ₹18.59K, while the 46–50 age group shows the lowest participation at ₹12.9K. This shows a clear trend of middle-aged adults (26–45) being the primary ethnic wear buyers.
Ethnic Wear Dashboard
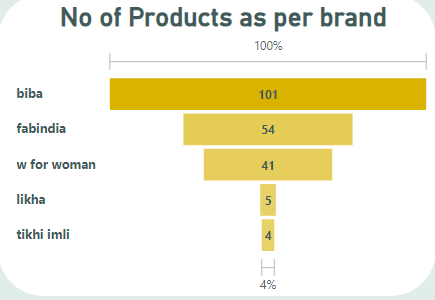
Product Distribution by Brand
Biba dominates the product catalog with 101 products, almost doubling Fabindia (54) and significantly ahead of others. Fabindia and W for Woman hold a decent product base with 54 and 41 products, respectively. Brands like Likha and Tikhi Imli have minimal presence with only 5 and 4 products, together contributing less than 4% of the catalog.