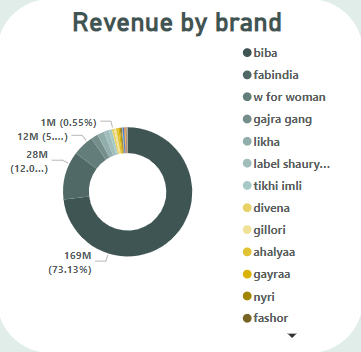
Summarizes historical performance, showing revenue distribution, customer count, and product variety across brands and platforms. What happened?
Ethnic Wear Dashboard
Unveiling Trends in Traditional & Cultural Fashion
Category :
Clothing
Powered by :
YbAISolution
Tool Used :
Power BI
Designer :
Bhrami Zadafiya
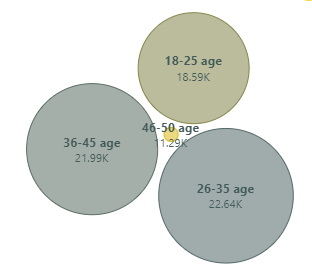
Purchase interest is high among ages 26–35 and 36–45; drops off in older age groups.
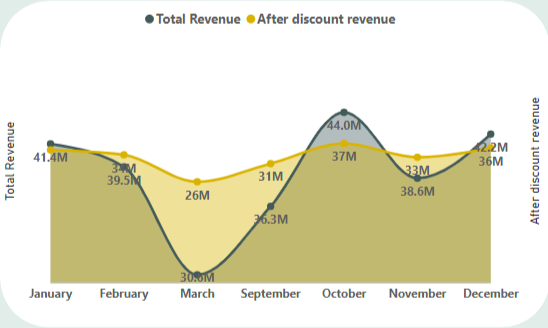
Revenue peaked in October (₹44M), with drops in November (₹33M) and a dip in March.
shows how discount-adjusted revenue evolved each month. Helps track campaign effectiveness and seasonality in fashion shopping. Uses consistent time intervals (months) to analyze sales behavior and performance trends.
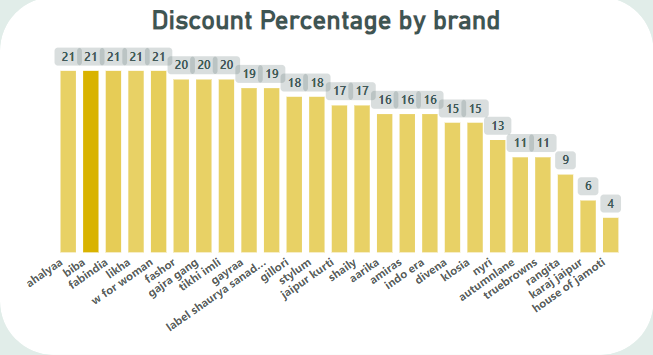
Biba, Ahalyaa, Fabindia, etc., offered 21%–20% discounts — showing a price competition strategy. Explores causes behind user actions, such as bounce rates and purchase drop-offs due to price sensitivity or design mismatch.
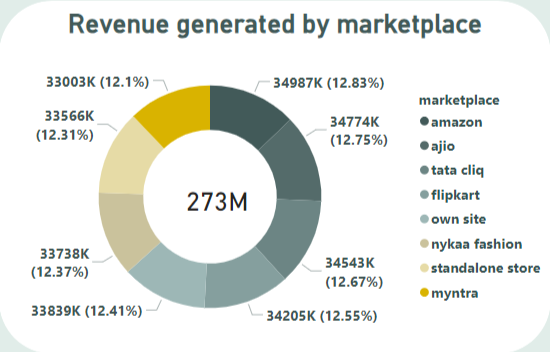
Amazon: ₹34.9M, Flipkart: ₹33.8M, Own Site: ₹34.2M—close competition among top platforms.
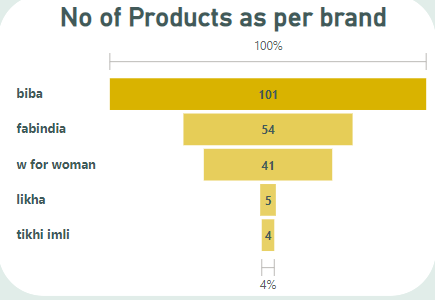
Biba dominates with 101 products and the majority of sales, compared to others like W for Woman or Likha with fewer SKUs. Compares performance across marketplaces, brands, and customer segments to determine key contributors.
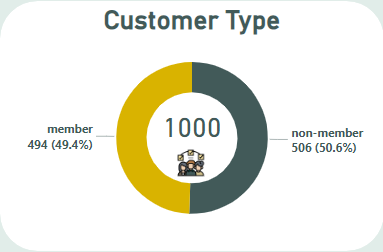
Membership Split: 50.6% non-members vs 49.4% members. Can influence loyalty program strategies. Analyzes buyer demographics, preferences, and behaviors to help improve targeting and personalization.
Most Purchases by Age Groups 26–35 and 36–45: Indicates the primary buyer persona.