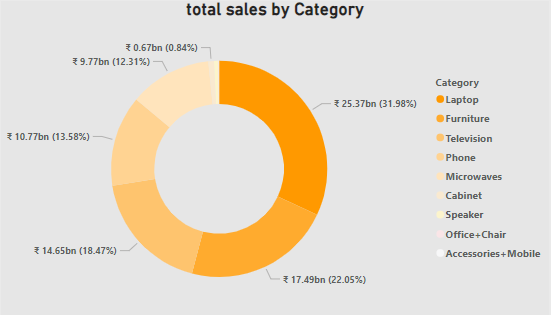
Identifies which categories (e.g., Laptop, Furniture) performed best.
Amazon Sales Dashboard
Unlock Hidden Insights: Transforming Amazon Data into Actionable Intelligence
Category :
E-commerce
Powered by :
YBAISolution
Tool Used :
Power BI
Designer :
Bhrami Zadafiya
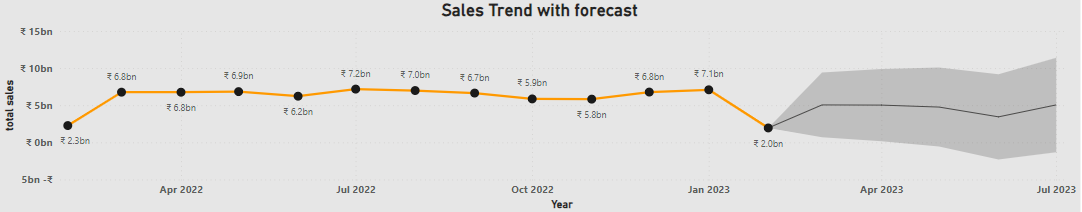
Visualizes how sales fluctuated over months (e.g., peaks in October and November), and whether it's rising or falling.
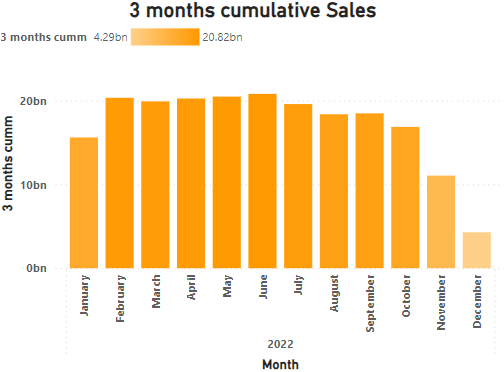
Compares sales build-up month-over-month to understand momentum.
Measures monthly performance, helps track financial progress and strategy effectiveness.
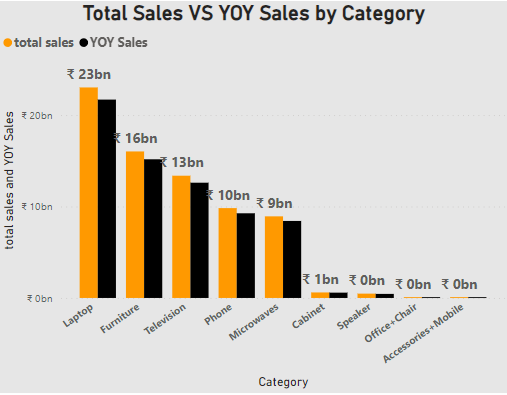
Measures year-over-year growth, ₹68.47bn sales change shows business scaling or contraction.
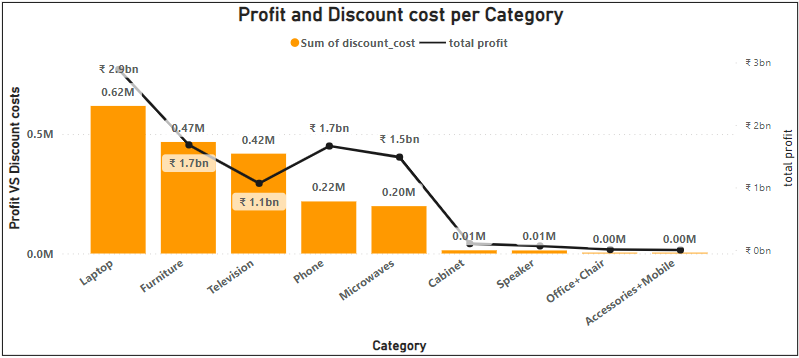
Reveals if certain categories (like Furniture, Televisions) are less profitable due to high discounting.
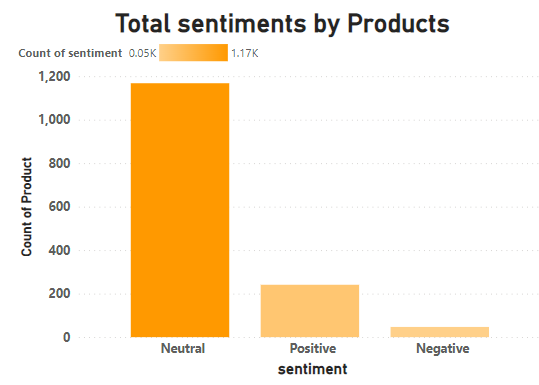
Associates ratings with sales, possibly identifying performance based on customer satisfaction.
Uses historical trends to project upcoming months' performance.
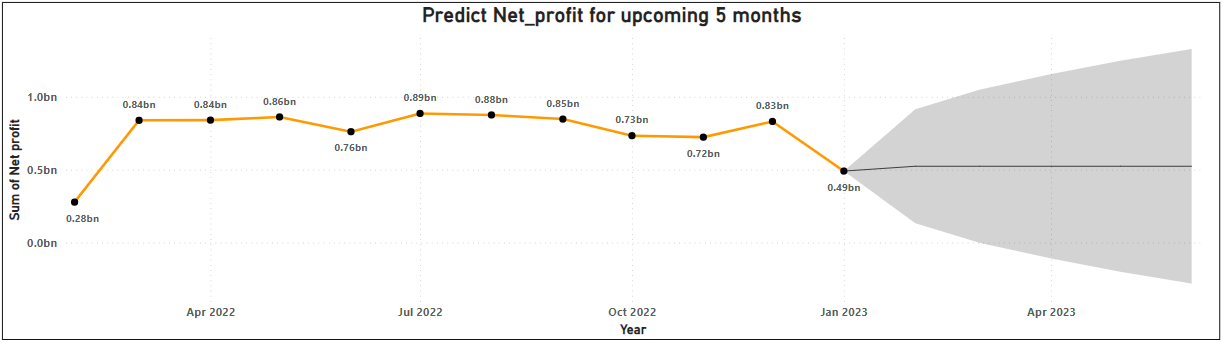
Uses historical trends to project upcoming months' profit.
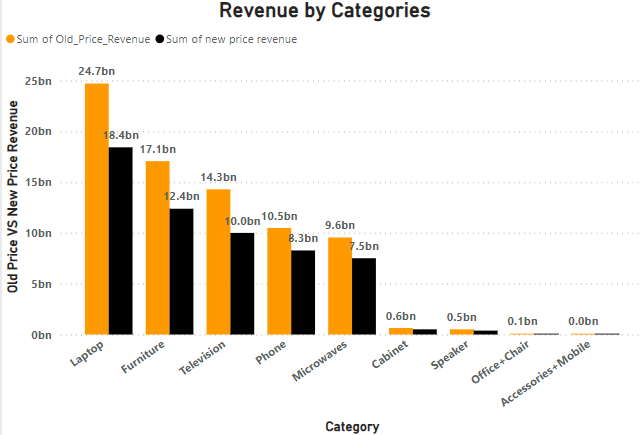
Identifies which categories gained or lost revenue due to pricing changes.